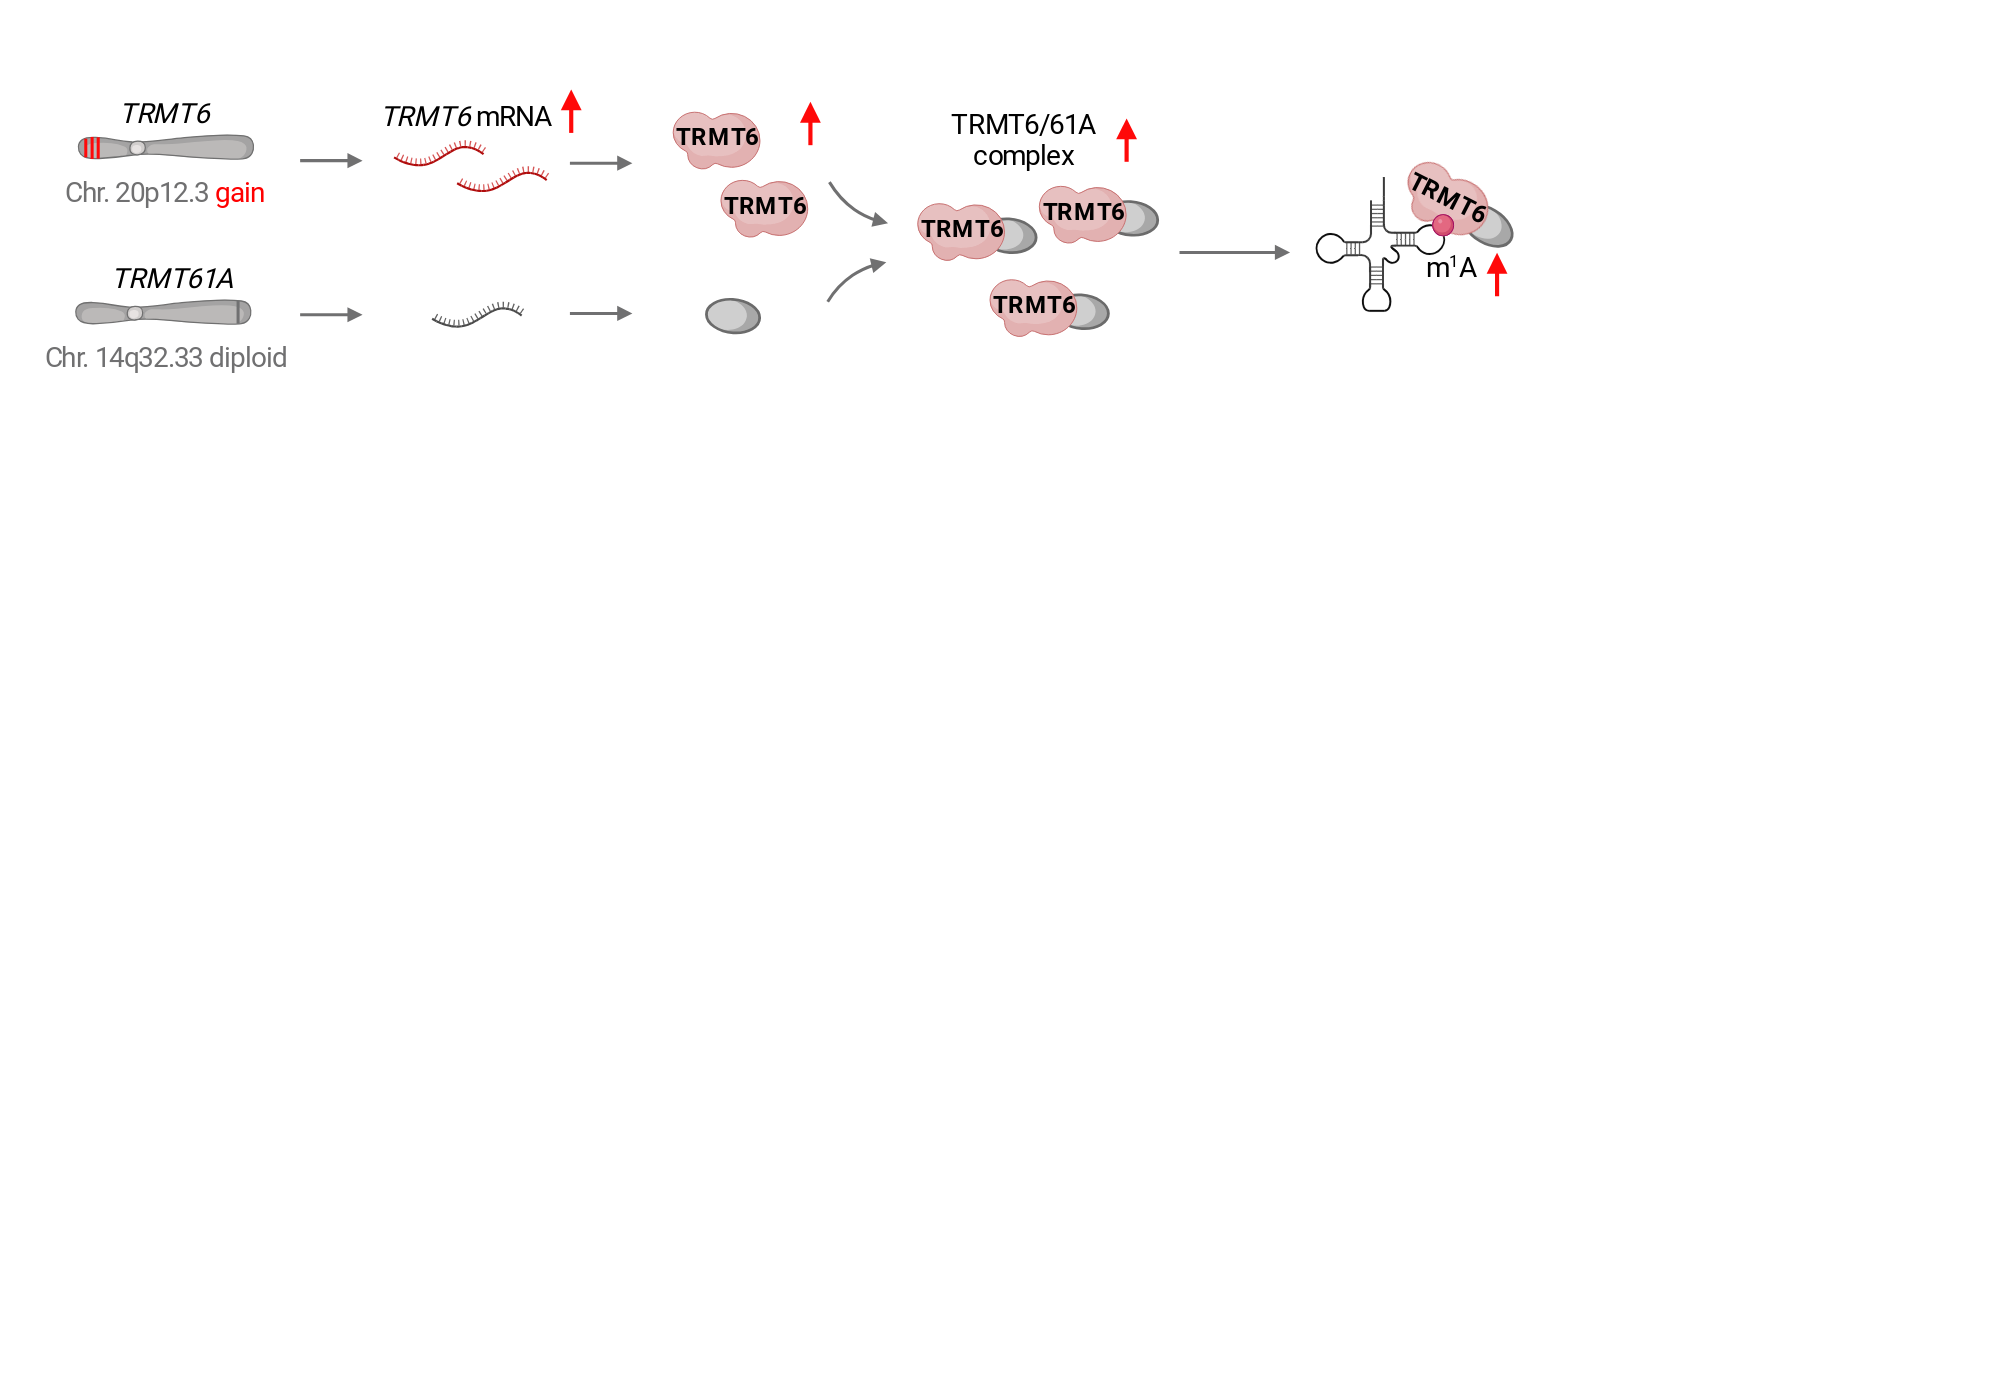
This schematic diagram illustrates that in colorectal cancer, overexpression of TRMT6 is driven by copy number gain, stabilizing the TRMT6/TRMT61A complex and ultimately resulting in elevated levels of tRNA m1A modification.

Tao, E


보기 전용


항목을 찾을 수 없습니다.
이 그림은 BioRender로 제작되었습니다. 지금 바로 전문가 수준의 과학 그림을 만들어 보세요!
30개 이상의 생명 과학 분야를 아우르는 50,000개 이상의 BioRender 사전 제작 아이콘 및 템플릿 라이브러리를 살펴보세요.
지금 바로 시작하기
설명
이 그림에 대한 설명이 제공되지 않았습니다.
No description
저자의 출판 및 라이선스 권한 확인
이 그림에 대한 확인 정보가 제공되지 않았습니다.
이 그림 인용 방법


본문 내 인용 복사
Created in BioRender. Tao, E. (2025) https://app.biorender.com/citation/67a59e7dbccc51a756fe0d9c
참고 문헌 복사 (APA 스타일)
Tao, E. (2025). This schematic diagram illustrates that in colorectal cancer, overexpression of TRMT6 is driven by copy number gain, stabilizing the TRMT6/TRMT61A complex and ultimately resulting in elevated levels of tRNA m1A modification.. Created in BioRender. https://app.biorender.com/citation/67a59e7dbccc51a756fe0d9c
이 그림 활용 방법
더 보기
간략히 보기


