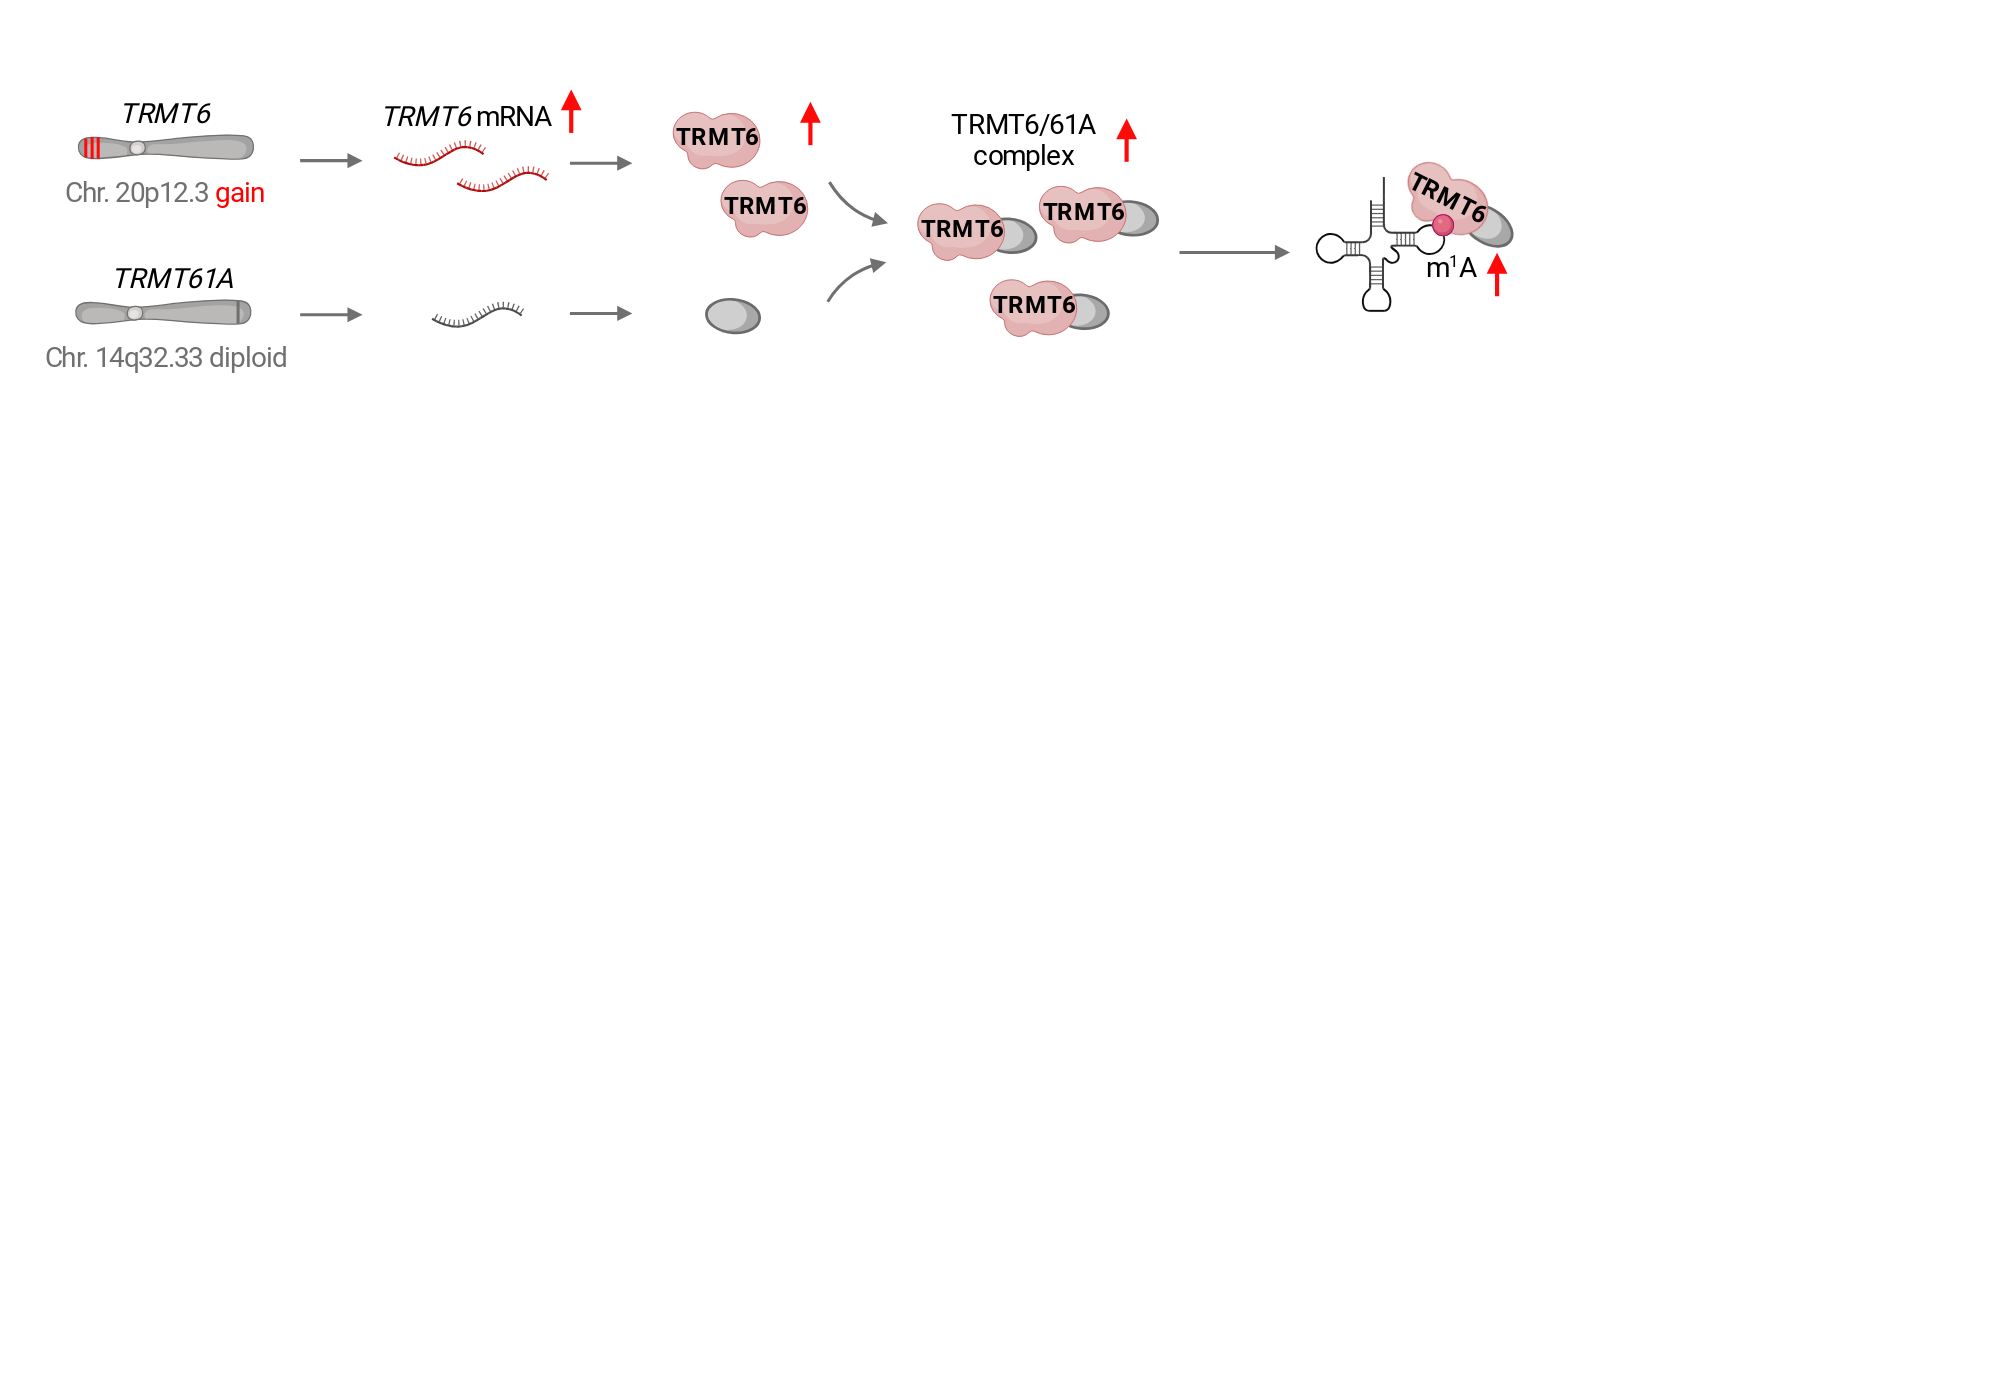
This schematic diagram illustrates that in colorectal cancer, overexpression of TRMT6 is driven by copy number gain, stabilizing the TRMT6/TRMT61A complex and ultimately resulting in elevated levels of tRNA m1A modification.
Created in BioRender. Tao, E. (2025) https://app.biorender.com/citation/67a59e7dbccc51a756fe0d9c
Copy bibliographic reference (APA Style)
Tao, E. (2025). This schematic diagram illustrates that in colorectal cancer, overexpression of TRMT6 is driven by copy number gain, stabilizing the TRMT6/TRMT61A complex and ultimately resulting in elevated levels of tRNA m1A modification.. Created in BioRender. https://app.biorender.com/citation/67a59e7dbccc51a756fe0d9c