登录
Back
产品系列
Products
产品
概览
插图绘制
AI 工具
Graphing
功能
图标库
模板库
学术海报生成器
AI 图表生成器
产品系列
Products
产品
概览
插图绘制
AI 工具
Graphing
功能
图标库
模板库
学术海报生成器
AI 图表生成器
人工智能
AI
AI 工具
科学研究中的人工智能应用指南
AI 对科学可信度的影响
Leo by BioRender:AI 图表构建器
利用 AI 更快地构建和优化图表。生成自定义图表,应用 BioRender 风格,并创建流程图、实验方案和时间轴。
了解更多 →
人工智能
AI
AI 工具
科学研究中的人工智能应用指南
AI 对科学可信度的影响
Leo by BioRender:AI 图表构建器
利用 AI 更快地构建和优化图表。生成自定义图表,应用 BioRender 风格,并创建流程图、实验方案和时间轴。
了解更多 →
解决方案
Solutions
受众
工业界
学术界
应用案例
出版物与期刊
科研基金与资助申请
演示文稿与幻灯片
图形摘要
实验方案
头脑风暴
资源
Resources
学习
网络研讨会
指南与教程
帮助中心
参与
线下活动
博客
案例研究
解决方案
Solutions
受众
工业界
学术界
应用案例
出版物与期刊
科研基金与资助申请
演示文稿与幻灯片
图形摘要
实验方案
头脑风暴
资源
Resources
学习
网络研讨会
指南与教程
帮助中心
参与
线下活动
博客
案例研究
定价
图标
模板
登录
联系销售
免费注册
几分钟内制作科学图表
使用 BioRender 科学绘图软件,通过可编辑的图标和模板创建出版级图表
感谢您的提交!我们已收到您的信息。
糟糕!提交表单时出错了。
免费开始使用
显示
52
个图表,涵盖
52
感谢您的提交!我们已收到您的信息。
糟糕!提交表单时出错了。
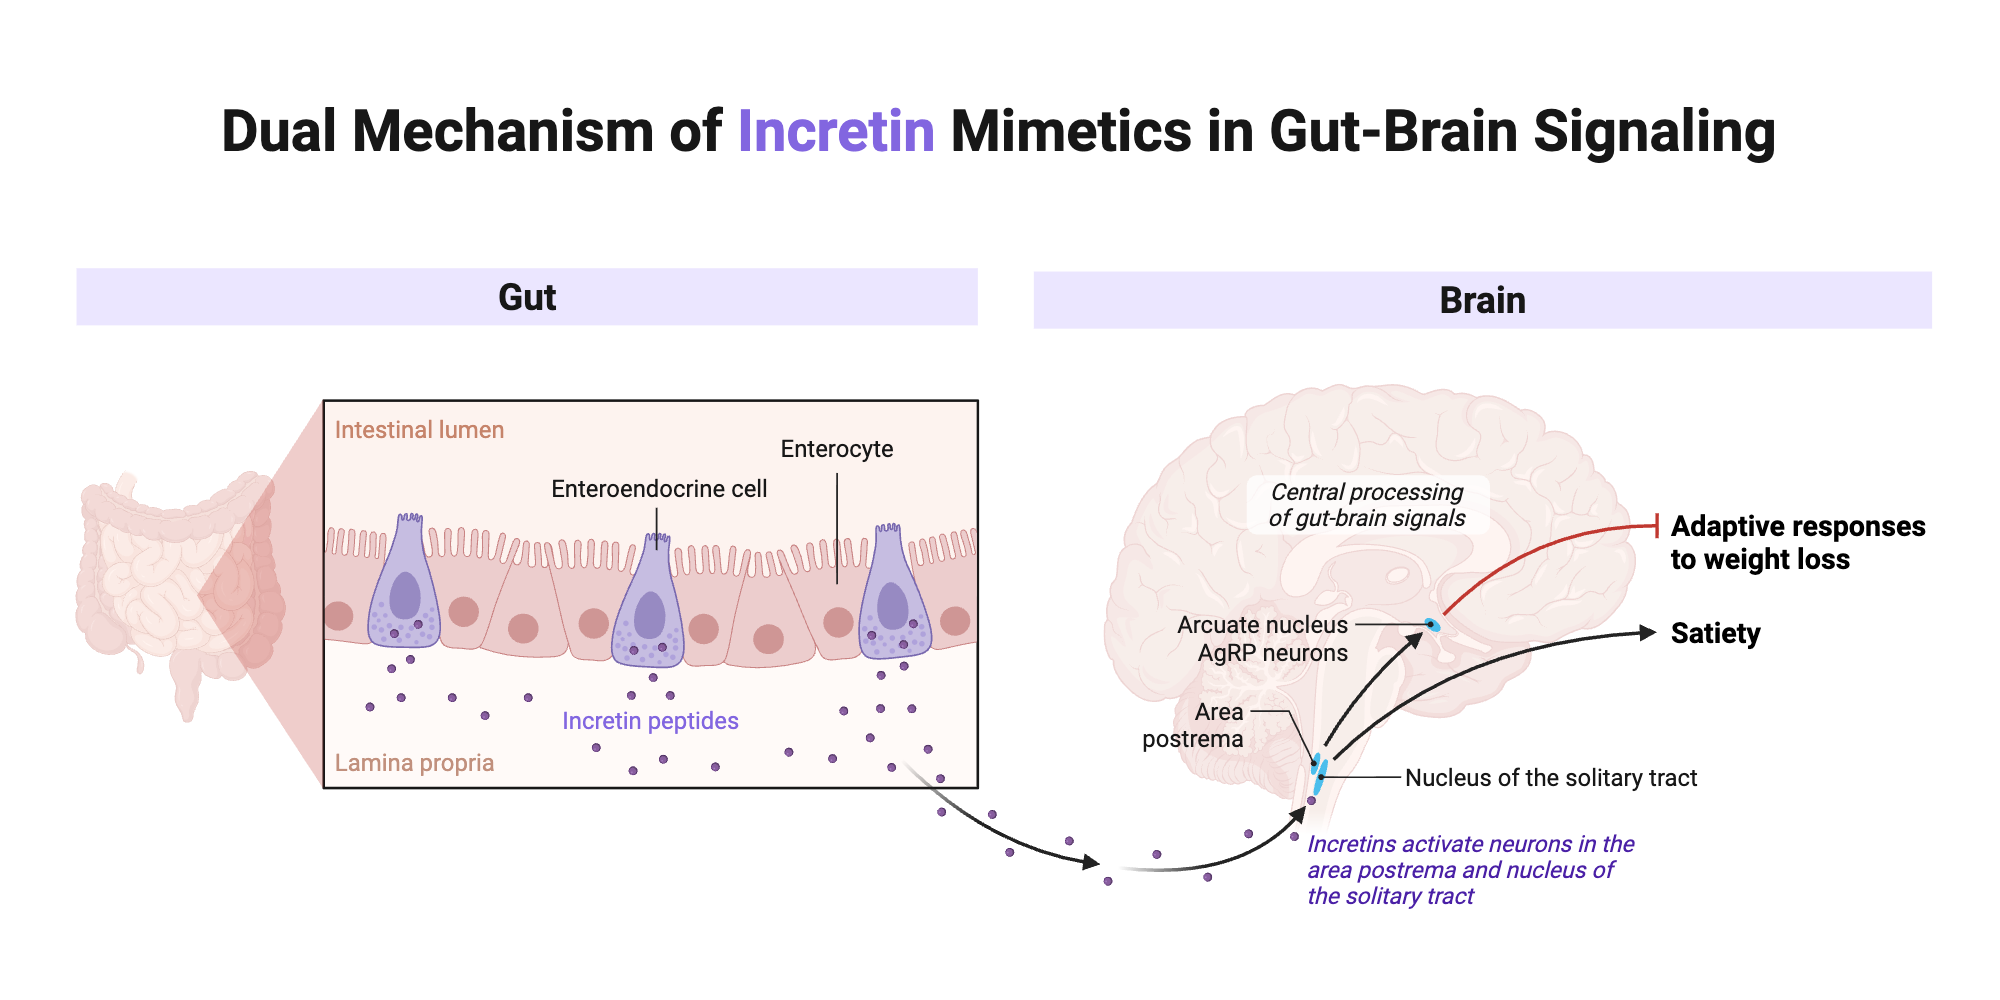
Dual Mechanism of Incretin Mimetics in Gut-Brain Signaling
领域
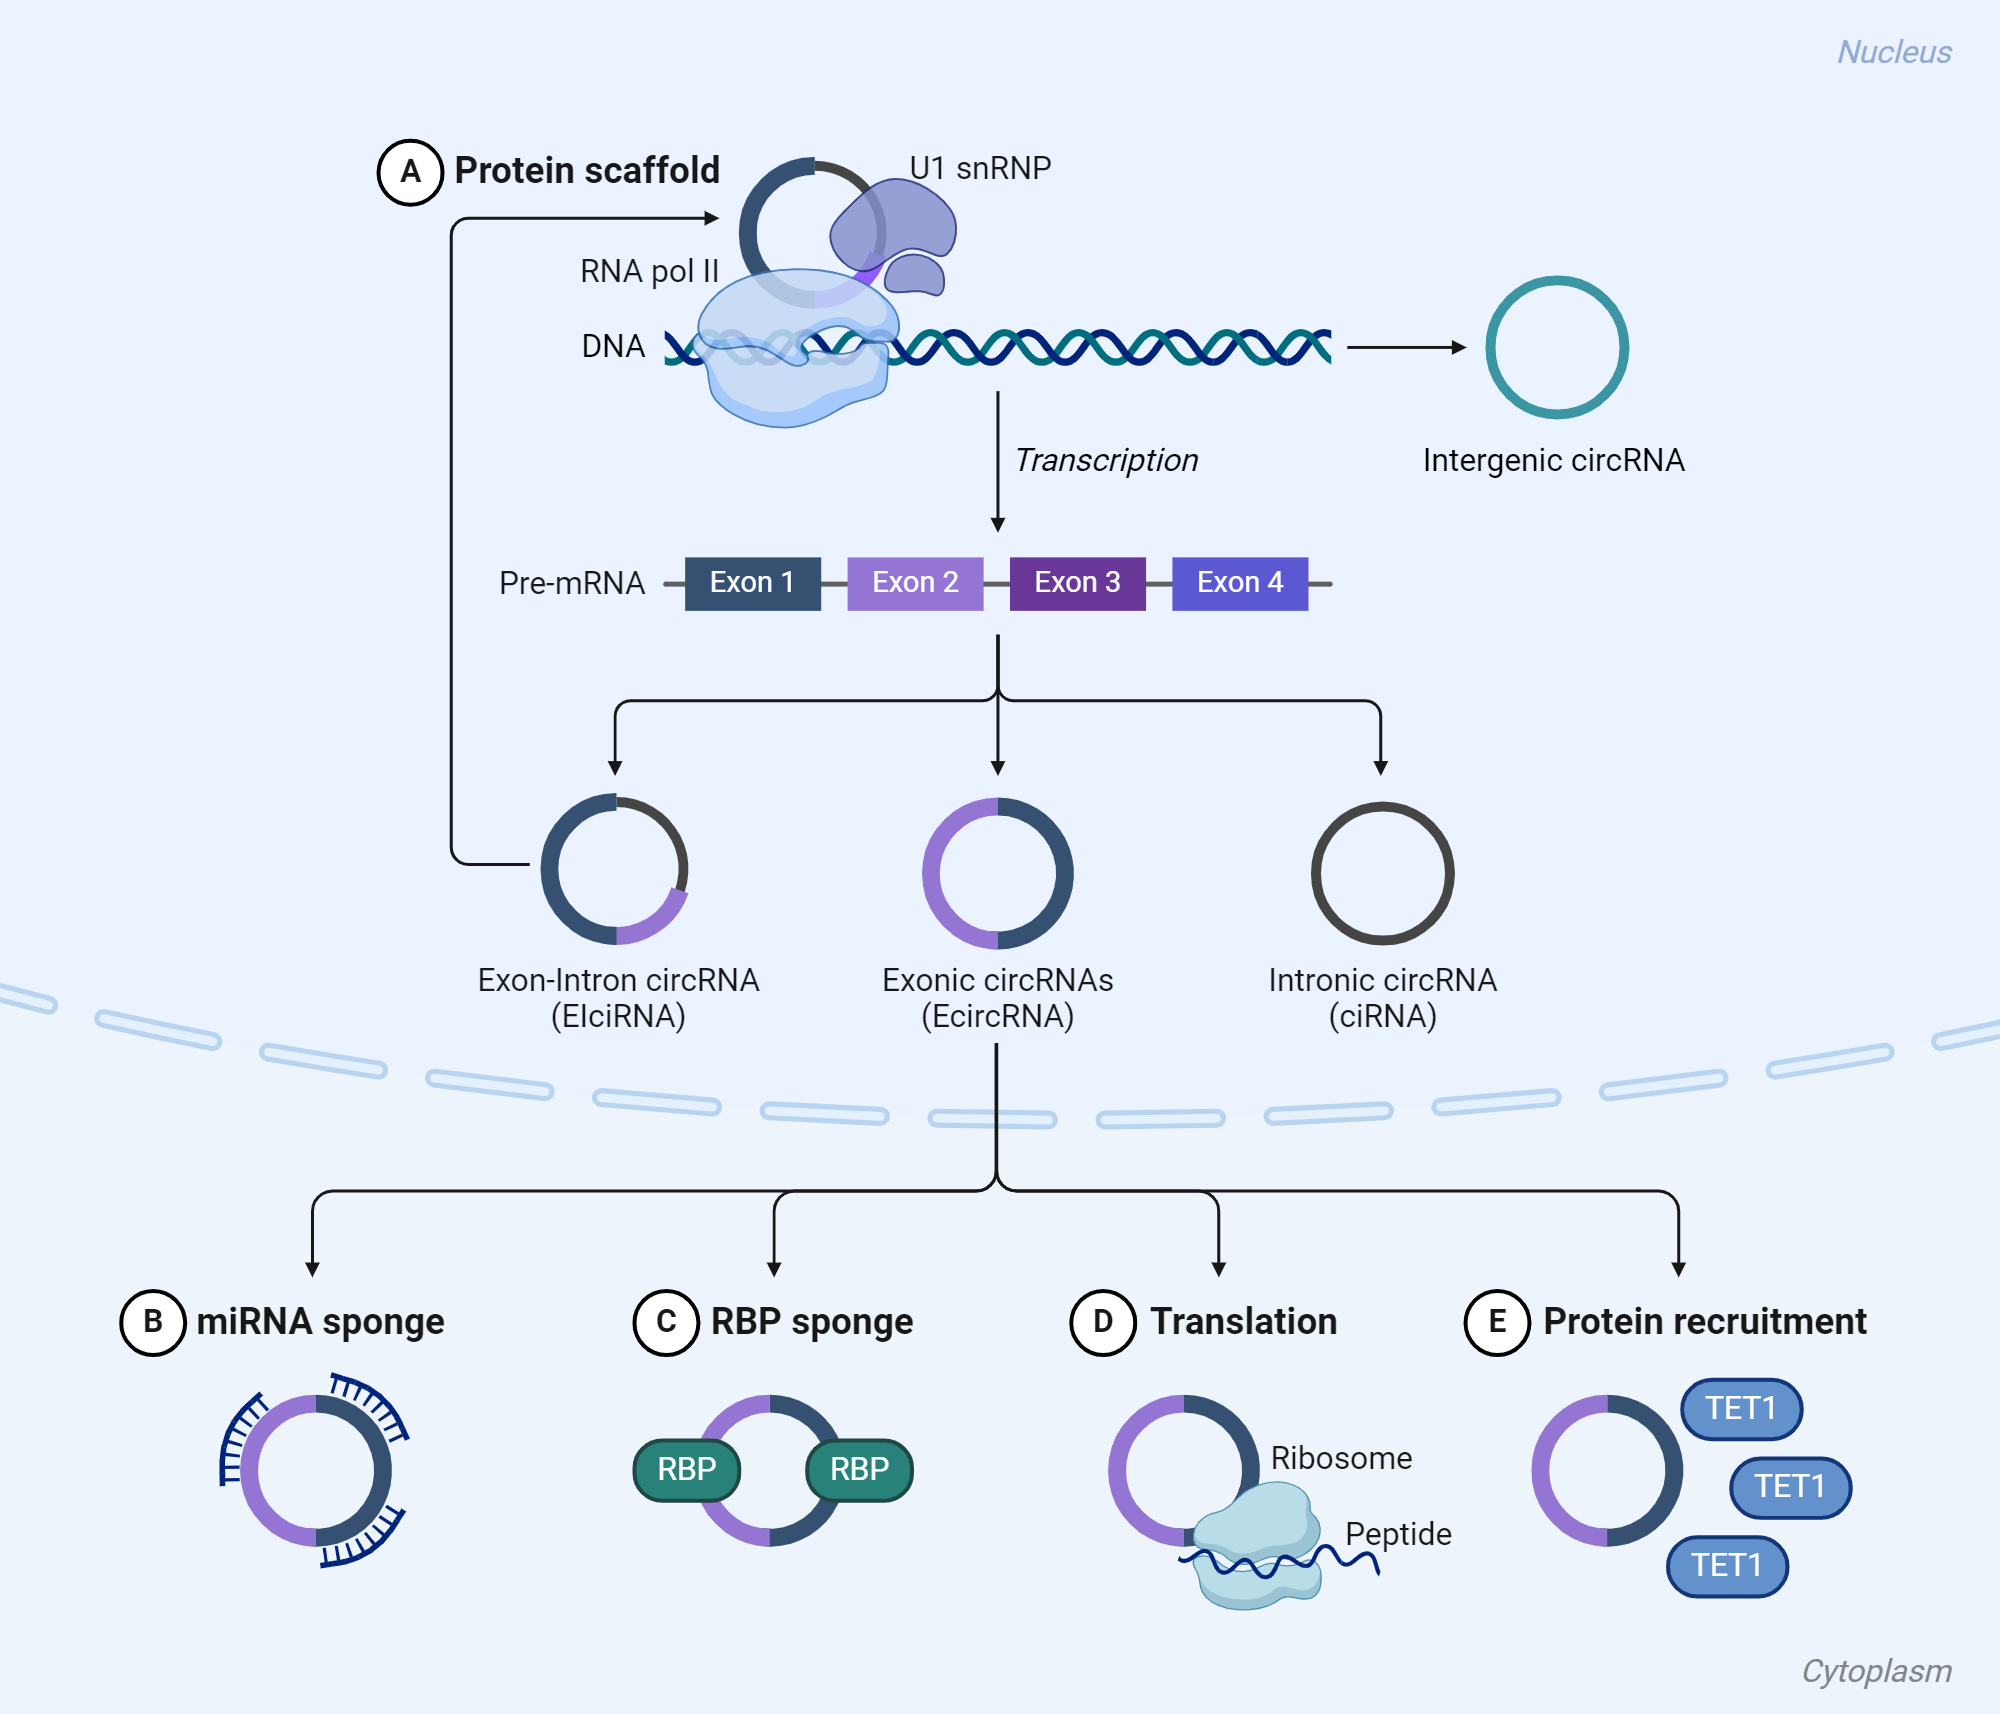
Biogenesis and Functions of CircRNAs
领域
Pathophysiology of Hypertension
领域
Postpartum Preeclampsia
领域
Sources of Microplastics
领域
Sources and Sinks of Heavy Metals in the Environment
领域
Recognition of LPS activates Innate Immune Response to Gram-Negative Bacteria
领域
The Role of Ubiquitin (Ub) in EGFR Trafficking
领域
Mechanisms of Heart Failure Linked to Mitochondrial Dysfunction
领域
α-Synuclein Degradation and Accumulation Pathways
领域
Physiological Metabolism of Aβ in the Brain and Periphery
领域
GLP-1 Effects on Target Tissues
领域
Structure of Chimeric Antigen Receptors (CAR)
领域
Preclinical Mouse Models in Age-Related Macular Degeneration (AMD) Treatment
领域
Molecular Mechanism of Action of Glucagon-like Peptide-1
领域
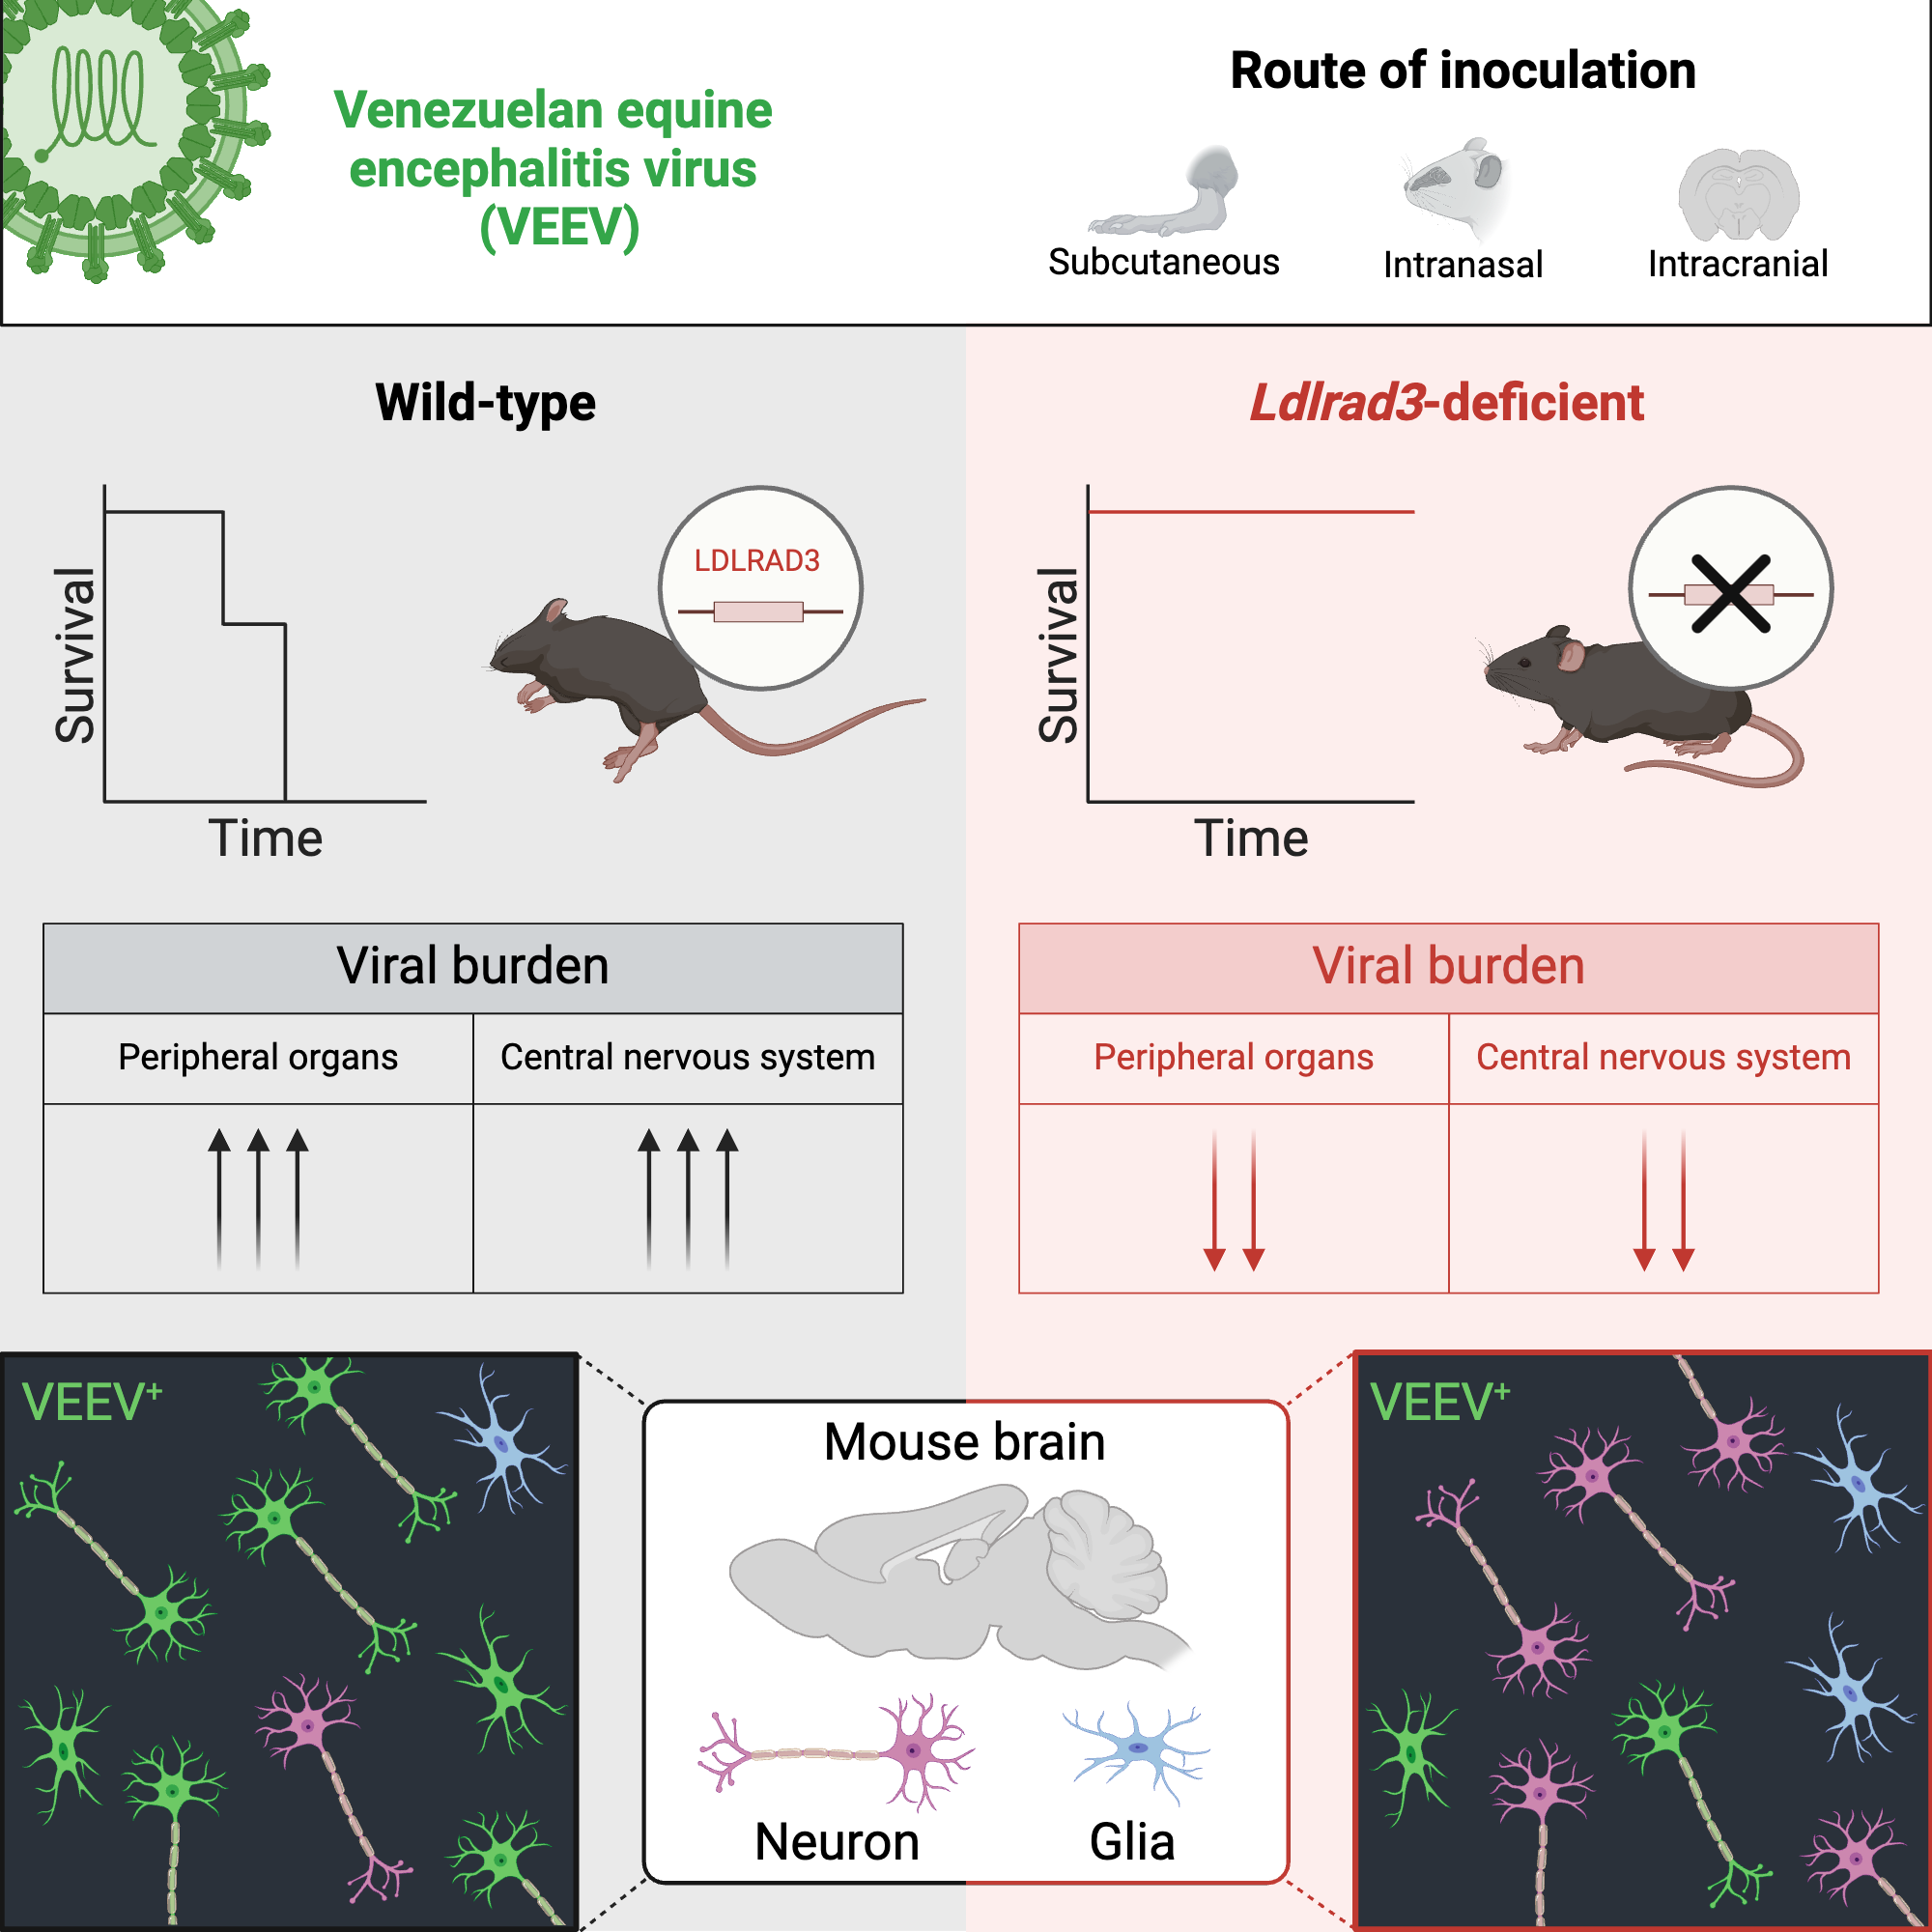
LDLRAD3 Pathogenesis | Graphical Abstract
领域
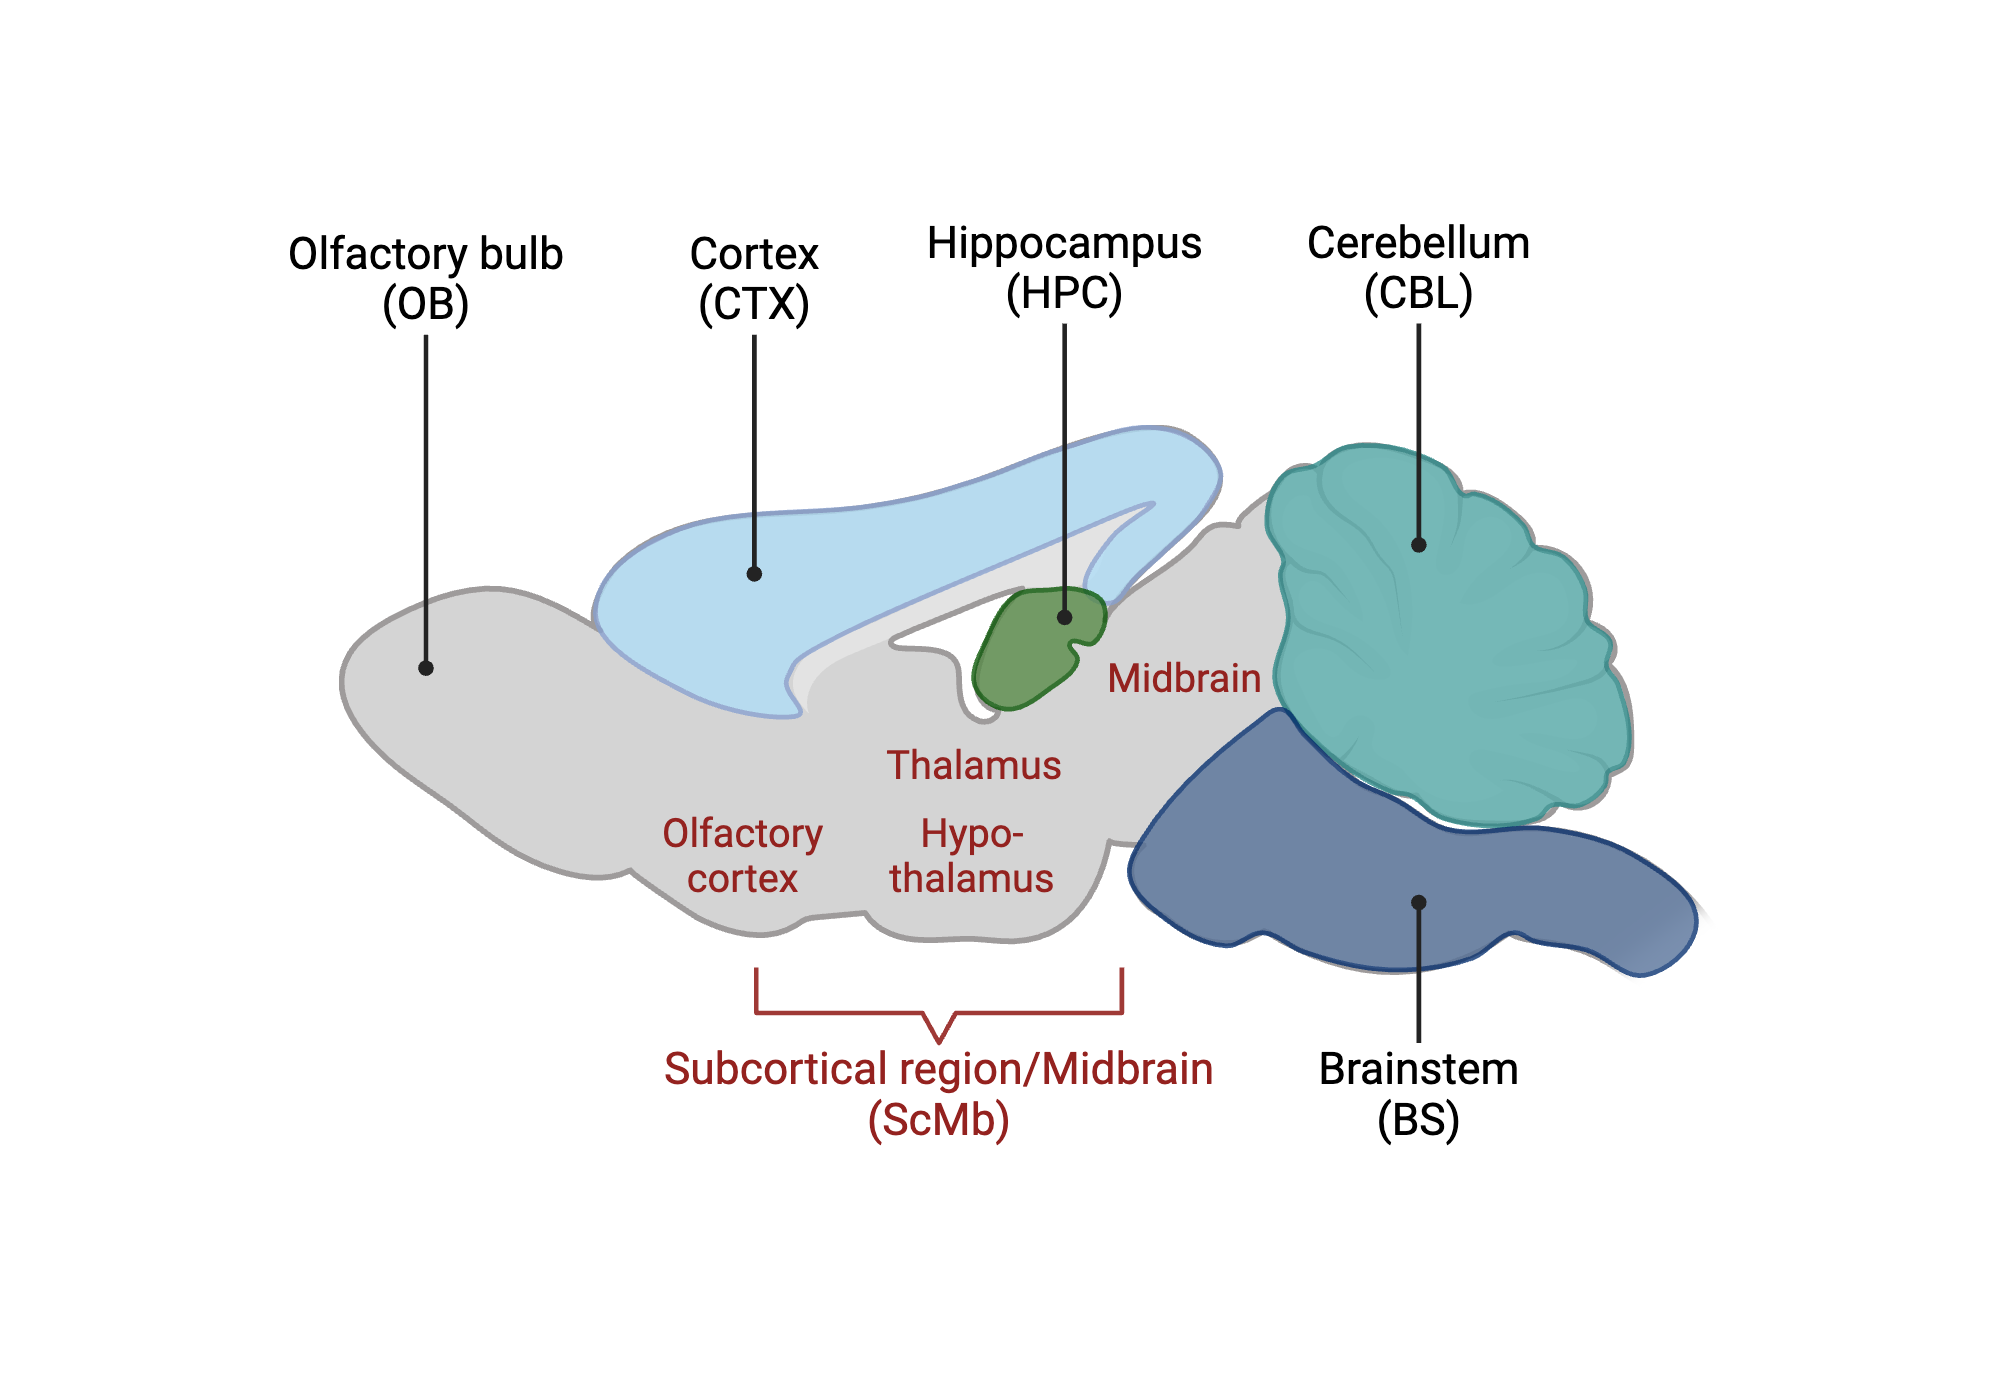
Schematic Mouse Brain Regions
领域
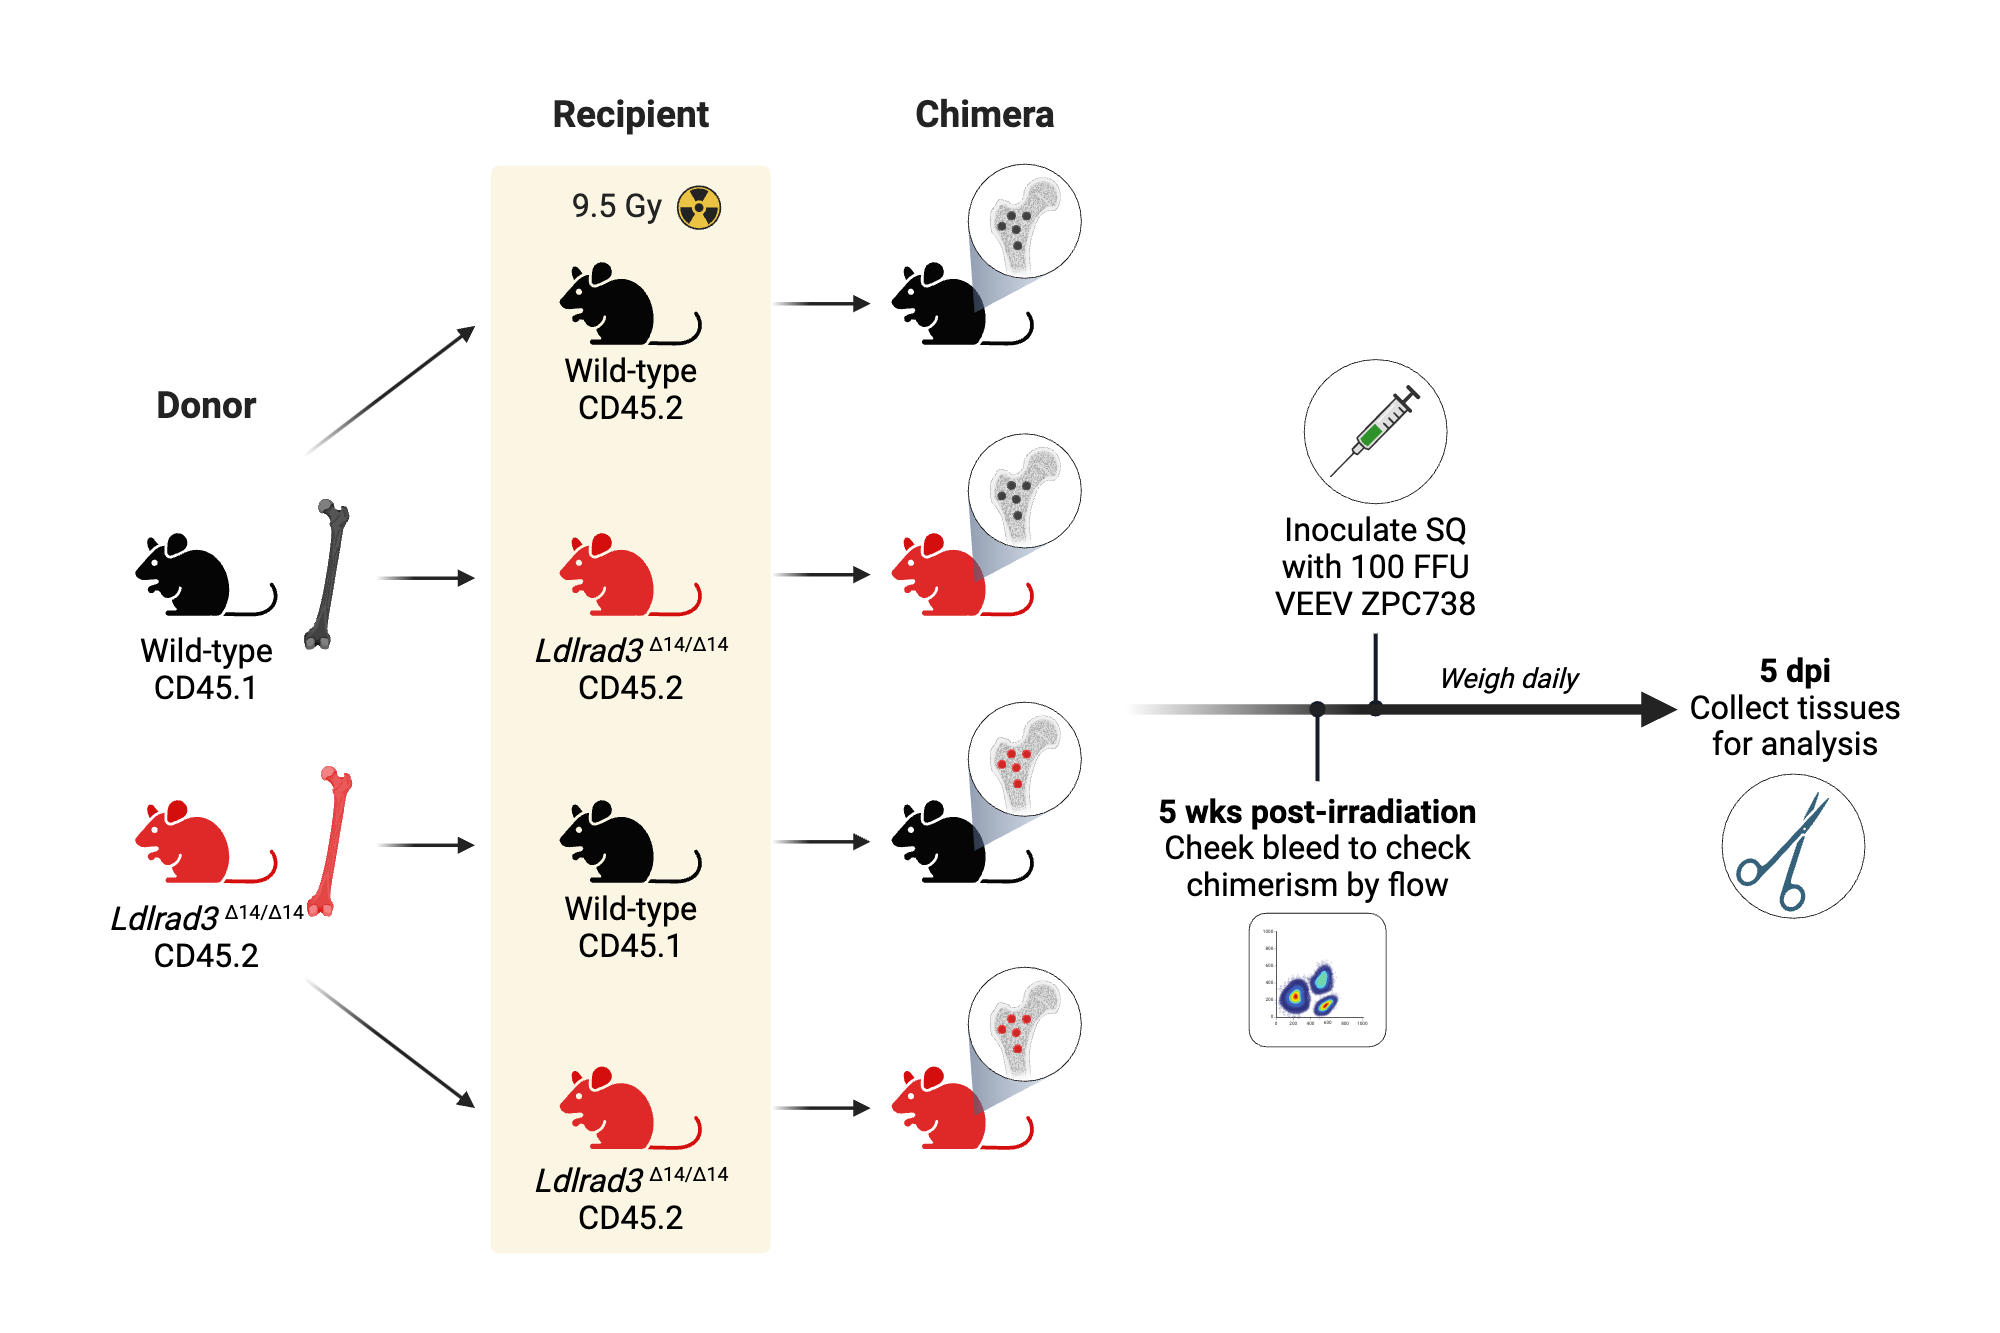
Experimental scheme for generating wild-type and Ldlrad3Δ14/Δ14 bone marrow chimeric mice
领域
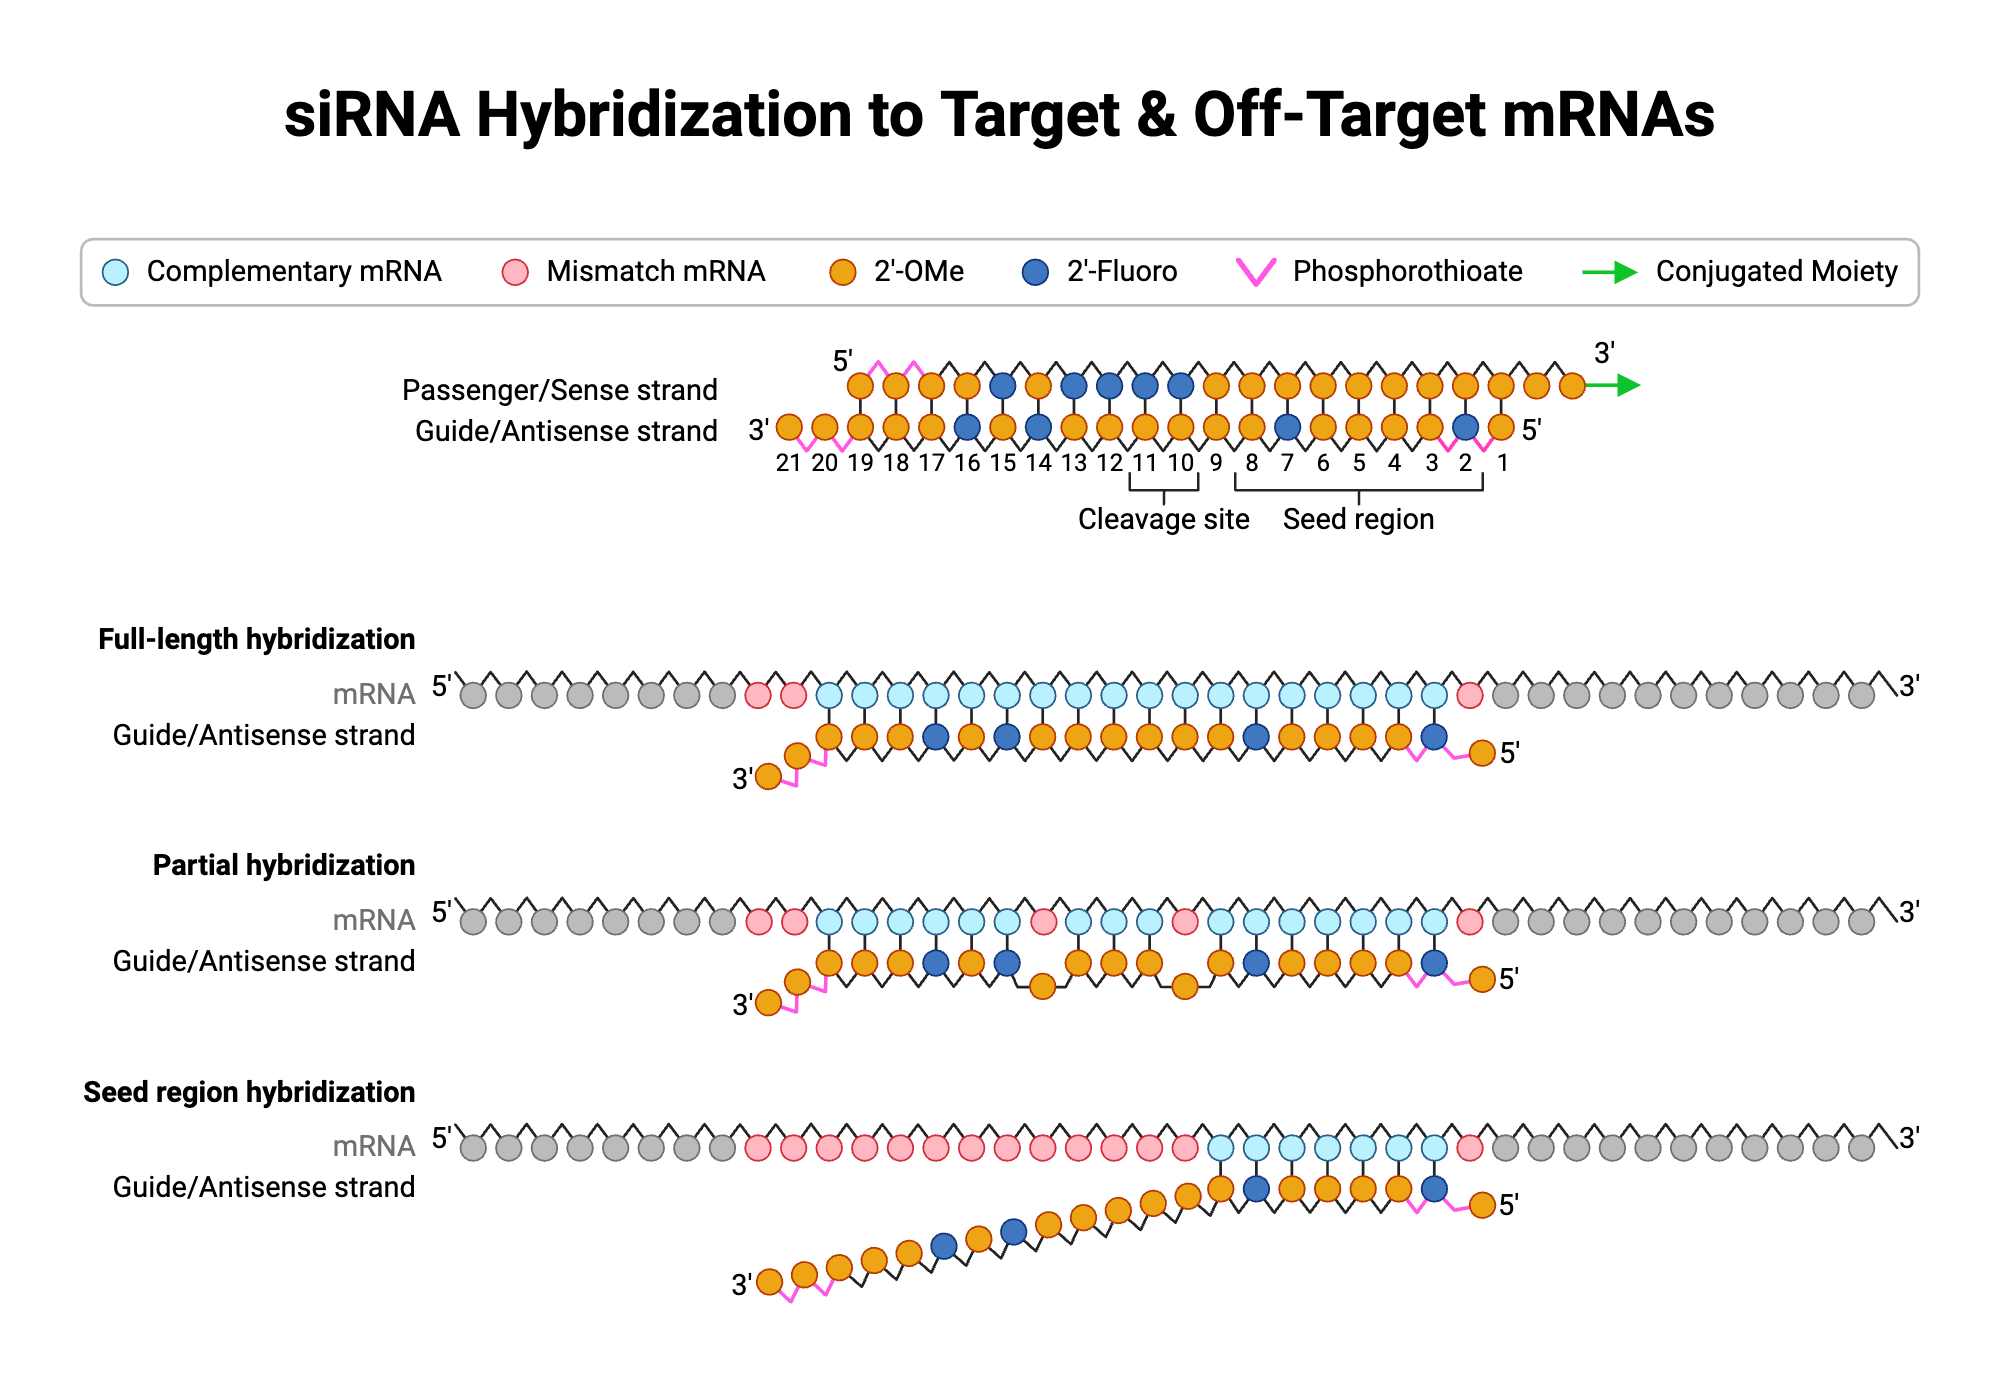
siRNA Hybridization to Target & Off-Target mRNAs
领域
Spherical Agglomeration
领域
Gene Ontology (GO) Enrichment Analysis of Atrophy Progression in Parkinson's Disease
领域
Dose Response Curve (Linear) | 1 Group | Increasing S-shaped | Mean Points
领域
Column Graph (Vertical) | 4 Groups | Data Points Showing
领域
Column graph (Vertical) | 4 Groups
领域
Column Graph (Vertical) | 2 Groups x 2 Interventions | Data Points Showing
领域
Column Graph (Vertical) | 2 Groups x 2 Interventions
领域
Column Graph (Vertical) | 2 Groups | Data Points Showing
领域
Column graph (Vertical) | 2 Groups
领域
Chemokine (C-C Motif) Ligand 2 (CCL2) Expression in Lipopolysaccharide (LPS)-Treated Satellite Cells
领域
Case Fatality Rate (CFR) of COVID-19 by Age in The US
领域
Boxplot (Vertical) | 4 Groups | Data Points Showing
领域
Boxplot (Vertical) | 4 Groups
领域
Boxplot (Vertical) | 2 Groups| Data Points Showing
领域
Boxplot (Vertical) | 2 Groups x 2 Interventions | Data Points Showing
领域
Boxplot (Vertical) | 2 Groups x 2 Interventions
领域
Boxplot (Vertical) | 2 Groups
领域
Boxplot (Horizontal) | 4 Groups
领域
Boxplot (Horizontal) | 2 Groups x 2 Interventions
领域
Boxplot (Horizontal) | 2 Groups
领域
Violin Plot (Vertical) | 4 Groups | Data Points Showing
领域
Violin Plot (Vertical) | 4 Groups
领域
Violin Plot (Vertical) | 2 Groups x 2 Interventions
领域
Violin Plot (Vertical) | 2 Groups
领域
Violin Plot (Horizontal) | 4 Groups
领域
Violin Plot (Horizontal) | 2 Groups x 2 Interventions
领域
Violin Plot (Horizontal) | 2 Groups
领域
Tumor Volume vs. Weight in Mouse Xenograft Model
领域
Spontaneous Firing Activity of Motor Cortex in a Spiking Neural Network
领域
Radiotherapy Dose Response for TCP and NTCP
领域
Novel Object Recognition Test (NORT) in Transgenic Mouse Model of Alzheimer's Disease (AD)
领域
Mean Point (Vertical) | 4 Groups
领域
Mean Point (Vertical) | 2 Groups x 2 Interventions
领域
Mean Point (Horizontal) | 4 Groups
领域
Mean Point (Horizontal) | 2 Groups x 2 Interventions
领域
Mean Line (Vertical) | 4 Groups | Individual Data Points
领域
Mean Line (Vertical) | 2 Groups x 2 Interventions | Individual Data Points
领域
Mean Line (Horizontal) | 4 Groups | Individual Data Points
领域
Mean Line (Horizontal) | 2 Groups x 2 Interventions | Individual Data Points
领域
Linear Regression (One Observation at Each Level) | Positive Correlation | 1 Group | Individual Data Points
领域
Linear Regression (One Observation at Each Level) | No Correlation | 1 Group | Individual Data Points
领域
上一页
1
...
下一页
4 / 50
准备好开始了吗?
立即开始制作专业的科学图表
免费注册
联系销售