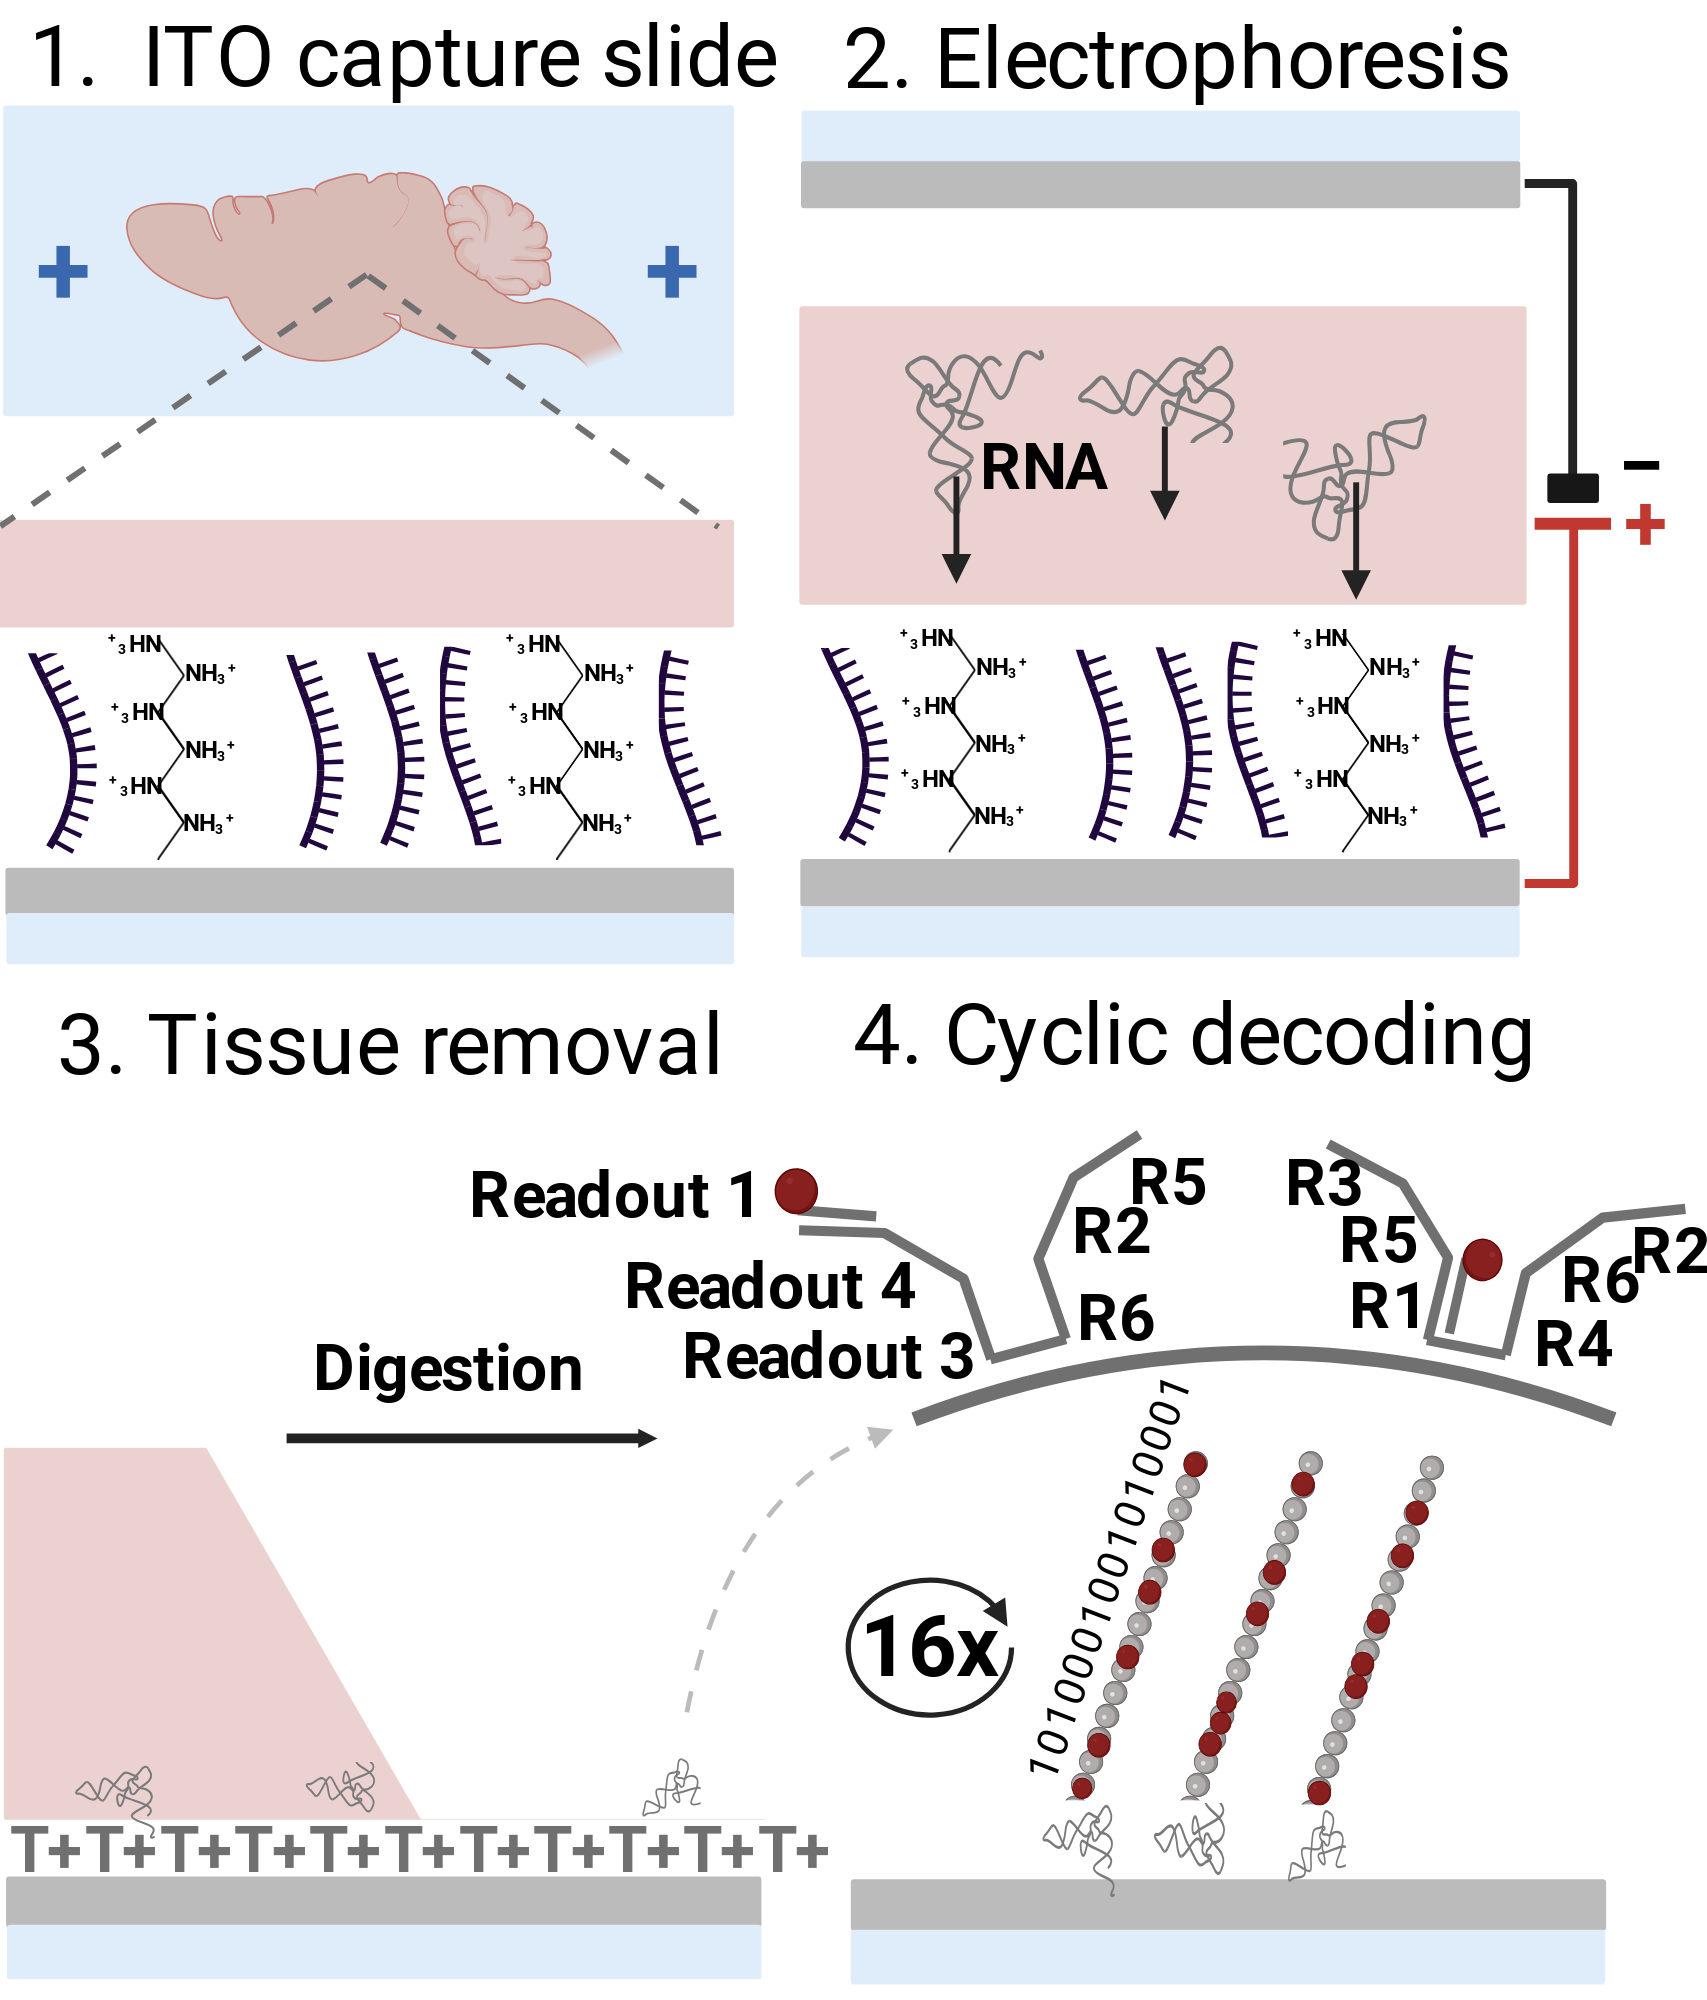
Figure 2. Highlighted spatial transcriptomics methods. A. Schematic illustration of the EEL FISH protocol,63 which involves RNA transfer by electrophoresis, capture on an ITO slide, tissue removal, and cyclic fluorescent probing and subsequent decoding.



Nur Ansicht


Keine Elemente gefunden.
Diese Abbildung wurde mit BioRender erstellt. Erstellen Sie jetzt Ihre eigene professionelle wissenschaftliche Abbildung!
Entdecken Sie die BioRender-Bibliothek mit über 50.000 vorgefertigten Icons und Vorlagen aus mehr als 30 Bereichen der Biowissenschaften.
Jetzt ausprobieren
Beschreibung
Für diese Abbildung wurde keine Beschreibung bereitgestellt.
No description
Bestätigung der Publikations- und Lizenzrechte des Autors
Für diese Abbildung wurde keine Bestätigung bereitgestellt.
So zitieren Sie diese Abbildung

Link zur Abbildung kopieren
https://app.biorender.com/citation/673ca9c95fc484a657443f86
Zitation im Text kopieren
Created in BioRender. Wang, R. (2024) https://app.biorender.com/citation/673ca9c95fc484a657443f86
Bibliografische Referenz kopieren (APA-Stil)
Wang, R. (2024). Figure 2. Highlighted spatial transcriptomics methods. A. Schematic illustration of the EEL FISH protocol,63 which involves RNA transfer by electrophoresis, capture on an ITO slide, tissue removal, and cyclic fluorescent probing and subsequent decoding.. Created in BioRender. https://app.biorender.com/citation/673ca9c95fc484a657443f86
Anwendung dieser Abbildung
Mehr anzeigen
Weniger anzeigen


