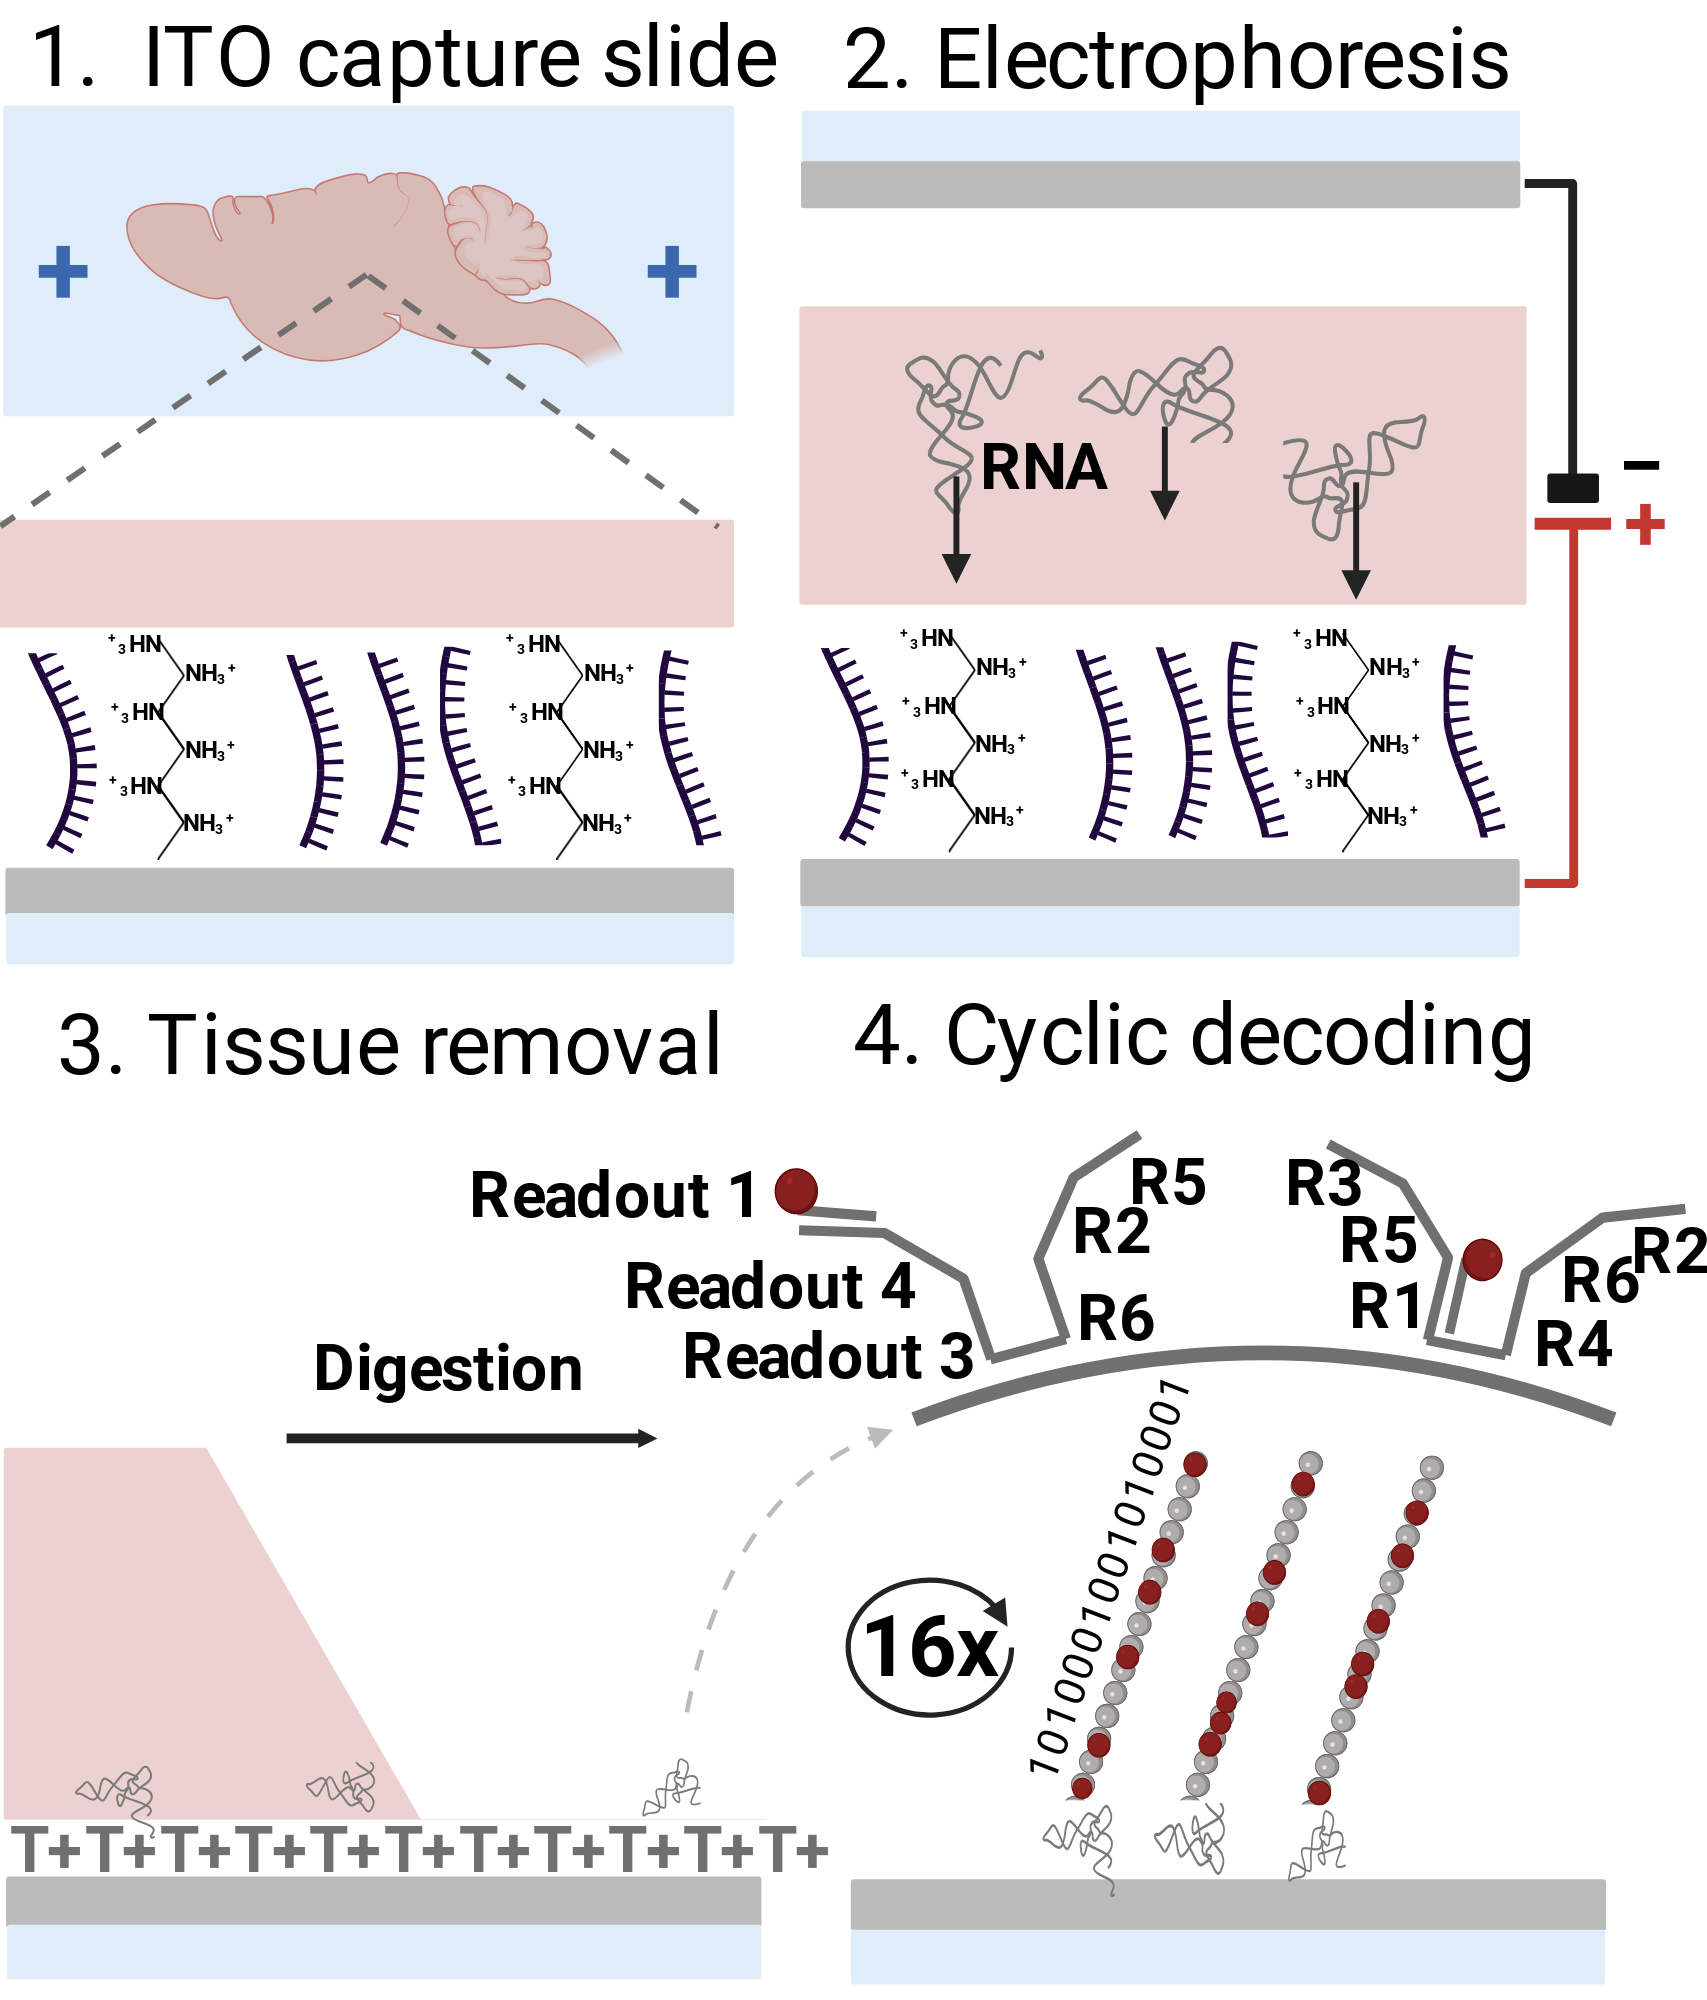
Figure 2. Highlighted spatial transcriptomics methods. A. Schematic illustration of the EEL FISH protocol,63 which involves RNA transfer by electrophoresis, capture on an ITO slide, tissue removal, and cyclic fluorescent probing and subsequent decoding.
Created in BioRender. Wang, R. (2024) https://app.biorender.com/citation/673ca9c95fc484a657443f86
Copy bibliographic reference (APA Style)
Wang, R. (2024). Figure 2. Highlighted spatial transcriptomics methods. A. Schematic illustration of the EEL FISH protocol,63 which involves RNA transfer by electrophoresis, capture on an ITO slide, tissue removal, and cyclic fluorescent probing and subsequent decoding.. Created in BioRender. https://app.biorender.com/citation/673ca9c95fc484a657443f86