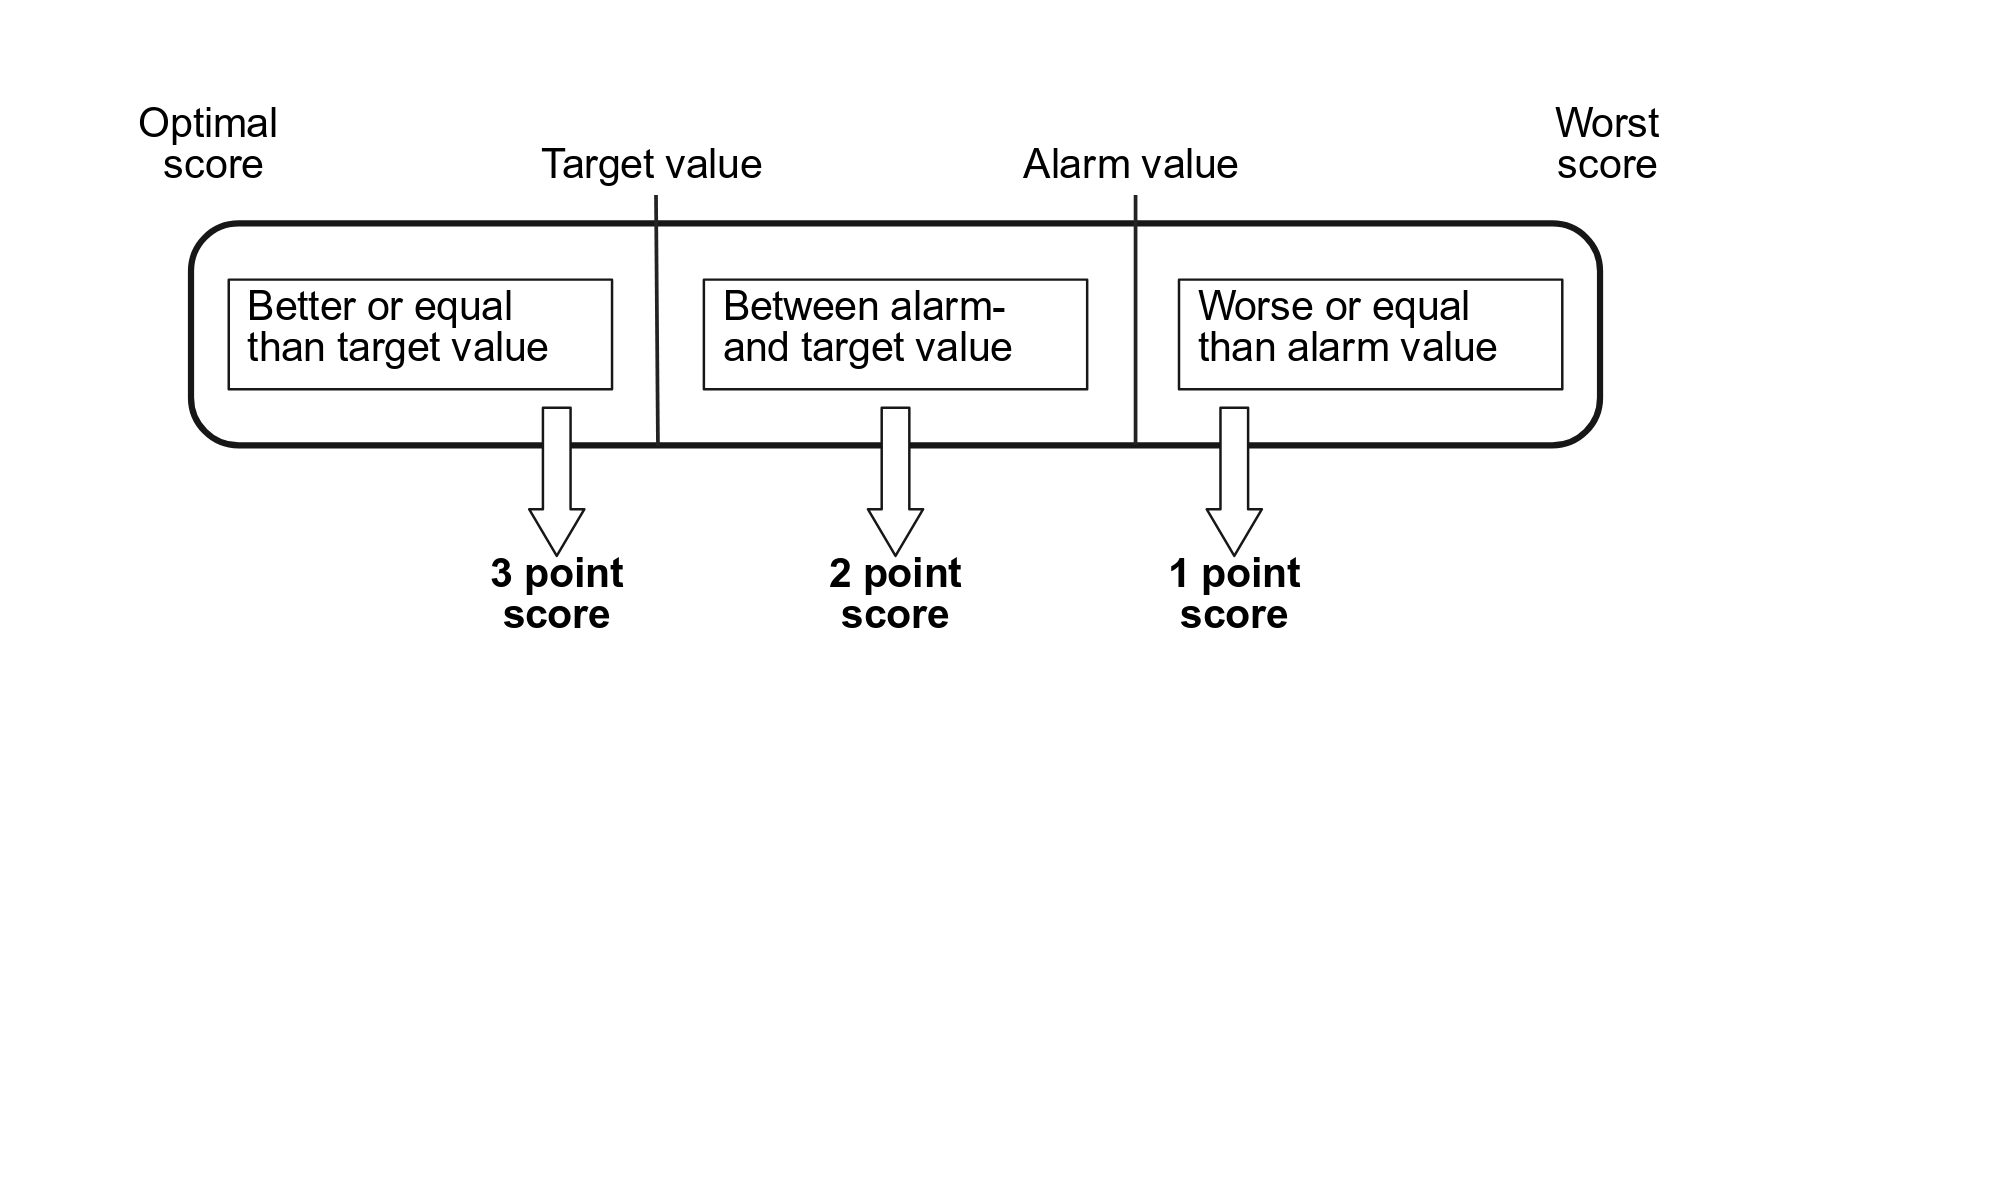
Figure 1: Illustration of the threshold value concept using defined target- and alarm values to classify single health and welfare indicator results and attribute a score of 1,2, or 3 points per indicator.



Lecture seule


Aucun élément trouvé.
Cette figure a été créée avec BioRender. Créez dès maintenant votre propre figure scientifique professionnelle !
Explorez la bibliothèque BioRender contenant plus de 50 000 icônes et modèles prédéfinis issus de plus de 30 domaines des sciences de la vie.
Essayer maintenant
Description
Aucune description n'a été fournie pour cette figure.
No description
Confirmation des droits de publication et de licence de l'auteur
Aucune confirmation n'a été fournie pour cette figure.
Comment citer cette figure

Copier le lien vers la figure
https://app.biorender.com/citation/67bde7b6234d3e22d547a7fc
Copier la citation dans le texte
Created in BioRender. Minnig, A. (2025) https://app.biorender.com/citation/67bde7b6234d3e22d547a7fc
Copier la référence bibliographique (style APA)
Minnig, A. (2025). Figure 1: Illustration of the threshold value concept using defined target- and alarm values to classify single health and welfare indicator results and attribute a score of 1,2, or 3 points per indicator.. Created in BioRender. https://app.biorender.com/citation/67bde7b6234d3e22d547a7fc
Comment utiliser cette figure
Afficher plus
Afficher moins


