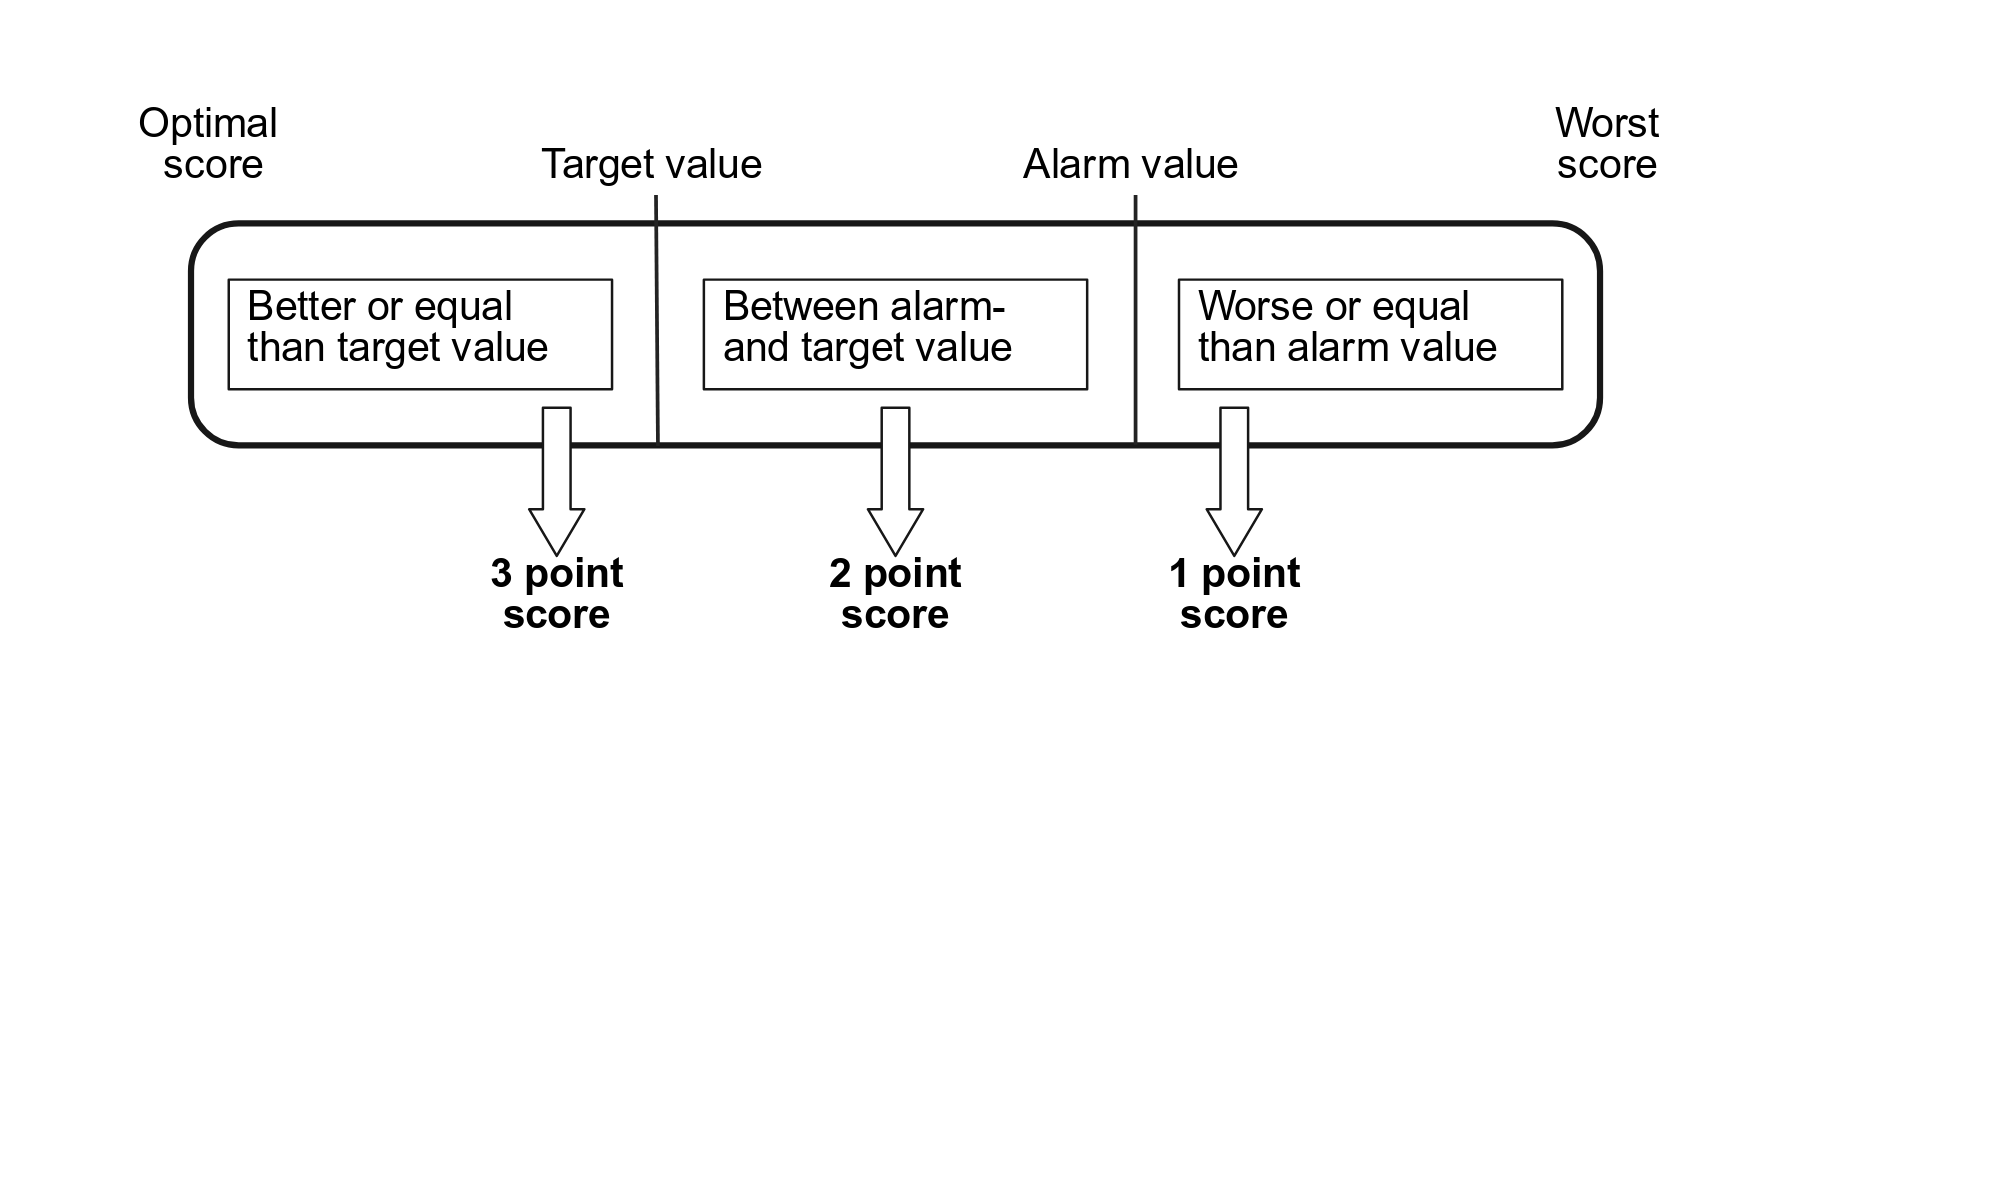
Figure 1: Illustration of the threshold value concept using defined target- and alarm values to classify single health and welfare indicator results and attribute a score of 1,2, or 3 points per indicator.
Created in BioRender. Minnig, A. (2025) https://app.biorender.com/citation/67bde7b6234d3e22d547a7fc
Copy bibliographic reference (APA Style)
Minnig, A. (2025). Figure 1: Illustration of the threshold value concept using defined target- and alarm values to classify single health and welfare indicator results and attribute a score of 1,2, or 3 points per indicator.. Created in BioRender. https://app.biorender.com/citation/67bde7b6234d3e22d547a7fc