Create professional science figures in seconds
Build publication-ready figures, graphs, and slides — all in one place. No design skills needed.
No download required.
Trusted by over 4 million scientists and thousands of research institutions


%20Logo.svg)


50K+
500K+
15+
4M+
From first figure to final presentation, all in one place
Analyze data, create graphs, and build figures alongside your team. Then, seamlessly turn them into posters, presentations, and more.
Analyze
Analyze and present your research data with automated data formatting and graphing.

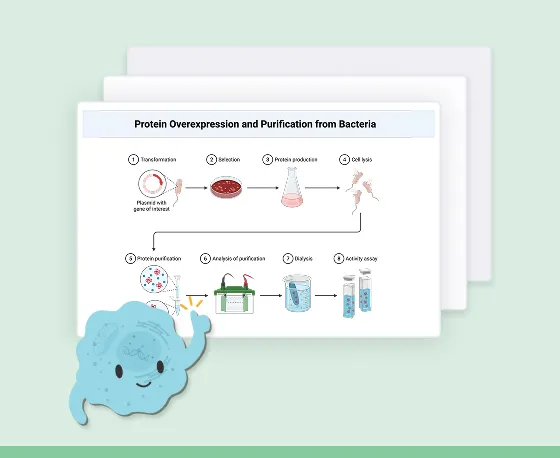
Illustrate
Create figures from our vast library of scientifically accurate and vetted images.

Collaborate
Organize, edit, and review figures together in one shared workspace.
Present
Submit and publish clear and concise visuals in grants, journals, filings, and more.


How pharma teams move research forward, faster
Align faster on complex science
Visuals that get everyone on the same page.
One platform for your entire team
No more files scattered across emails and local drives.
Trusted by all top 30 pharma companies
BioRender speeds up decision and improves collaboration.

Win more grants. Get published faster.
Up to 3x grant funding
BioRender labs report higher NIH funding. Read the case study.
500,000+ publication citations
An accepted standard at top journals like Nature, Science, and Cell.
15+ Nobel Prize winners
How Nobel Laureates visualize their most important work.


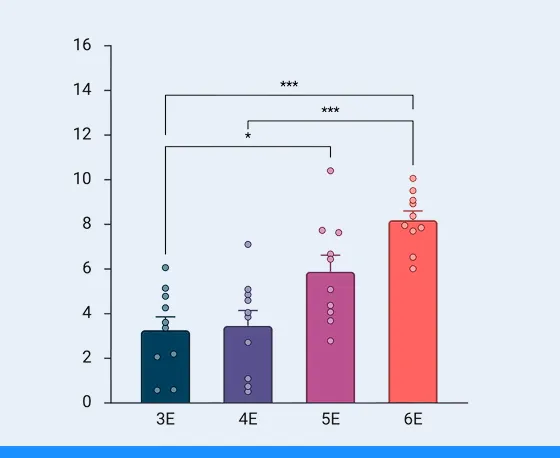
Turn raw data into publication-quality graphs in minutes
Drag and drop Prism, CSV, or Excel files—variables detected automatically.
Get analysis guidance and exclude outliers in one click.
Customize colors, labels, axes, and match styles across graphs instantly.
Share and co-edit graphs in real-time.
Powering visuals in the world’s leading journals