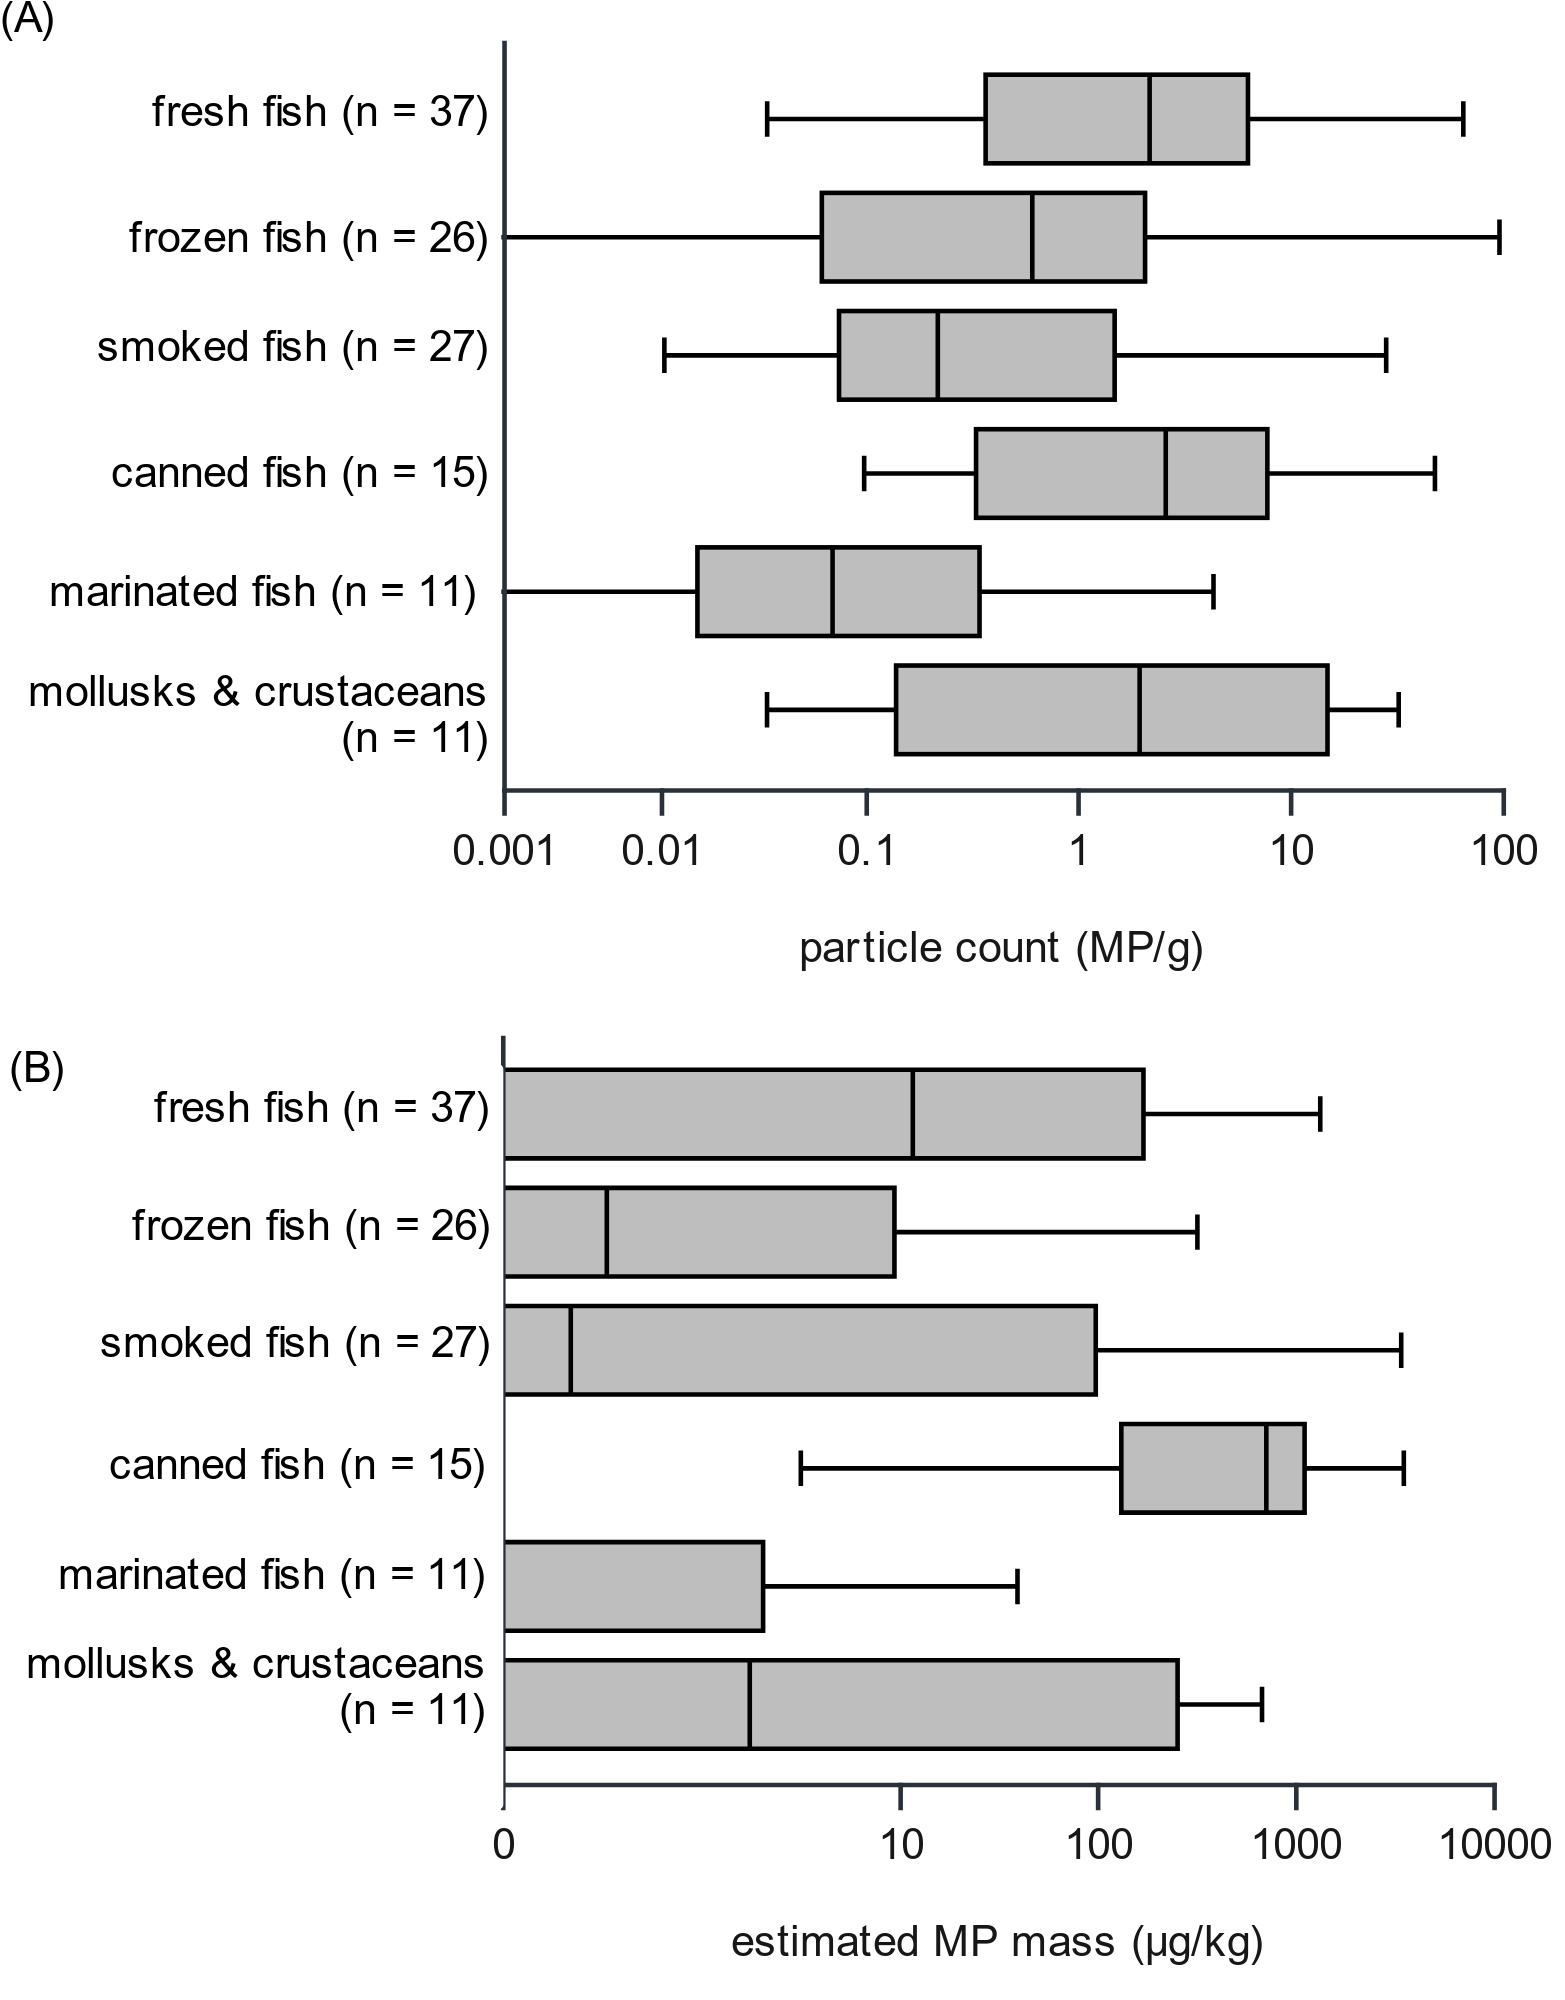
Box plots of MP particle counts (A) and MP mass estimates (B) in seafood grouped by product category. The number of screened samples per group is indicated in parentheses.
Created in BioRender. Süssmann, J. (2025) https://app.biorender.com/citation/67ebcb3c2a212fa52419c9a4
Copy bibliographic reference (APA Style)
Süssmann, J. (2025). Box plots of MP particle counts (A) and MP mass estimates (B) in seafood grouped by product category. The number of screened samples per group is indicated in parentheses.. Created in BioRender. https://app.biorender.com/citation/67ebcb3c2a212fa52419c9a4