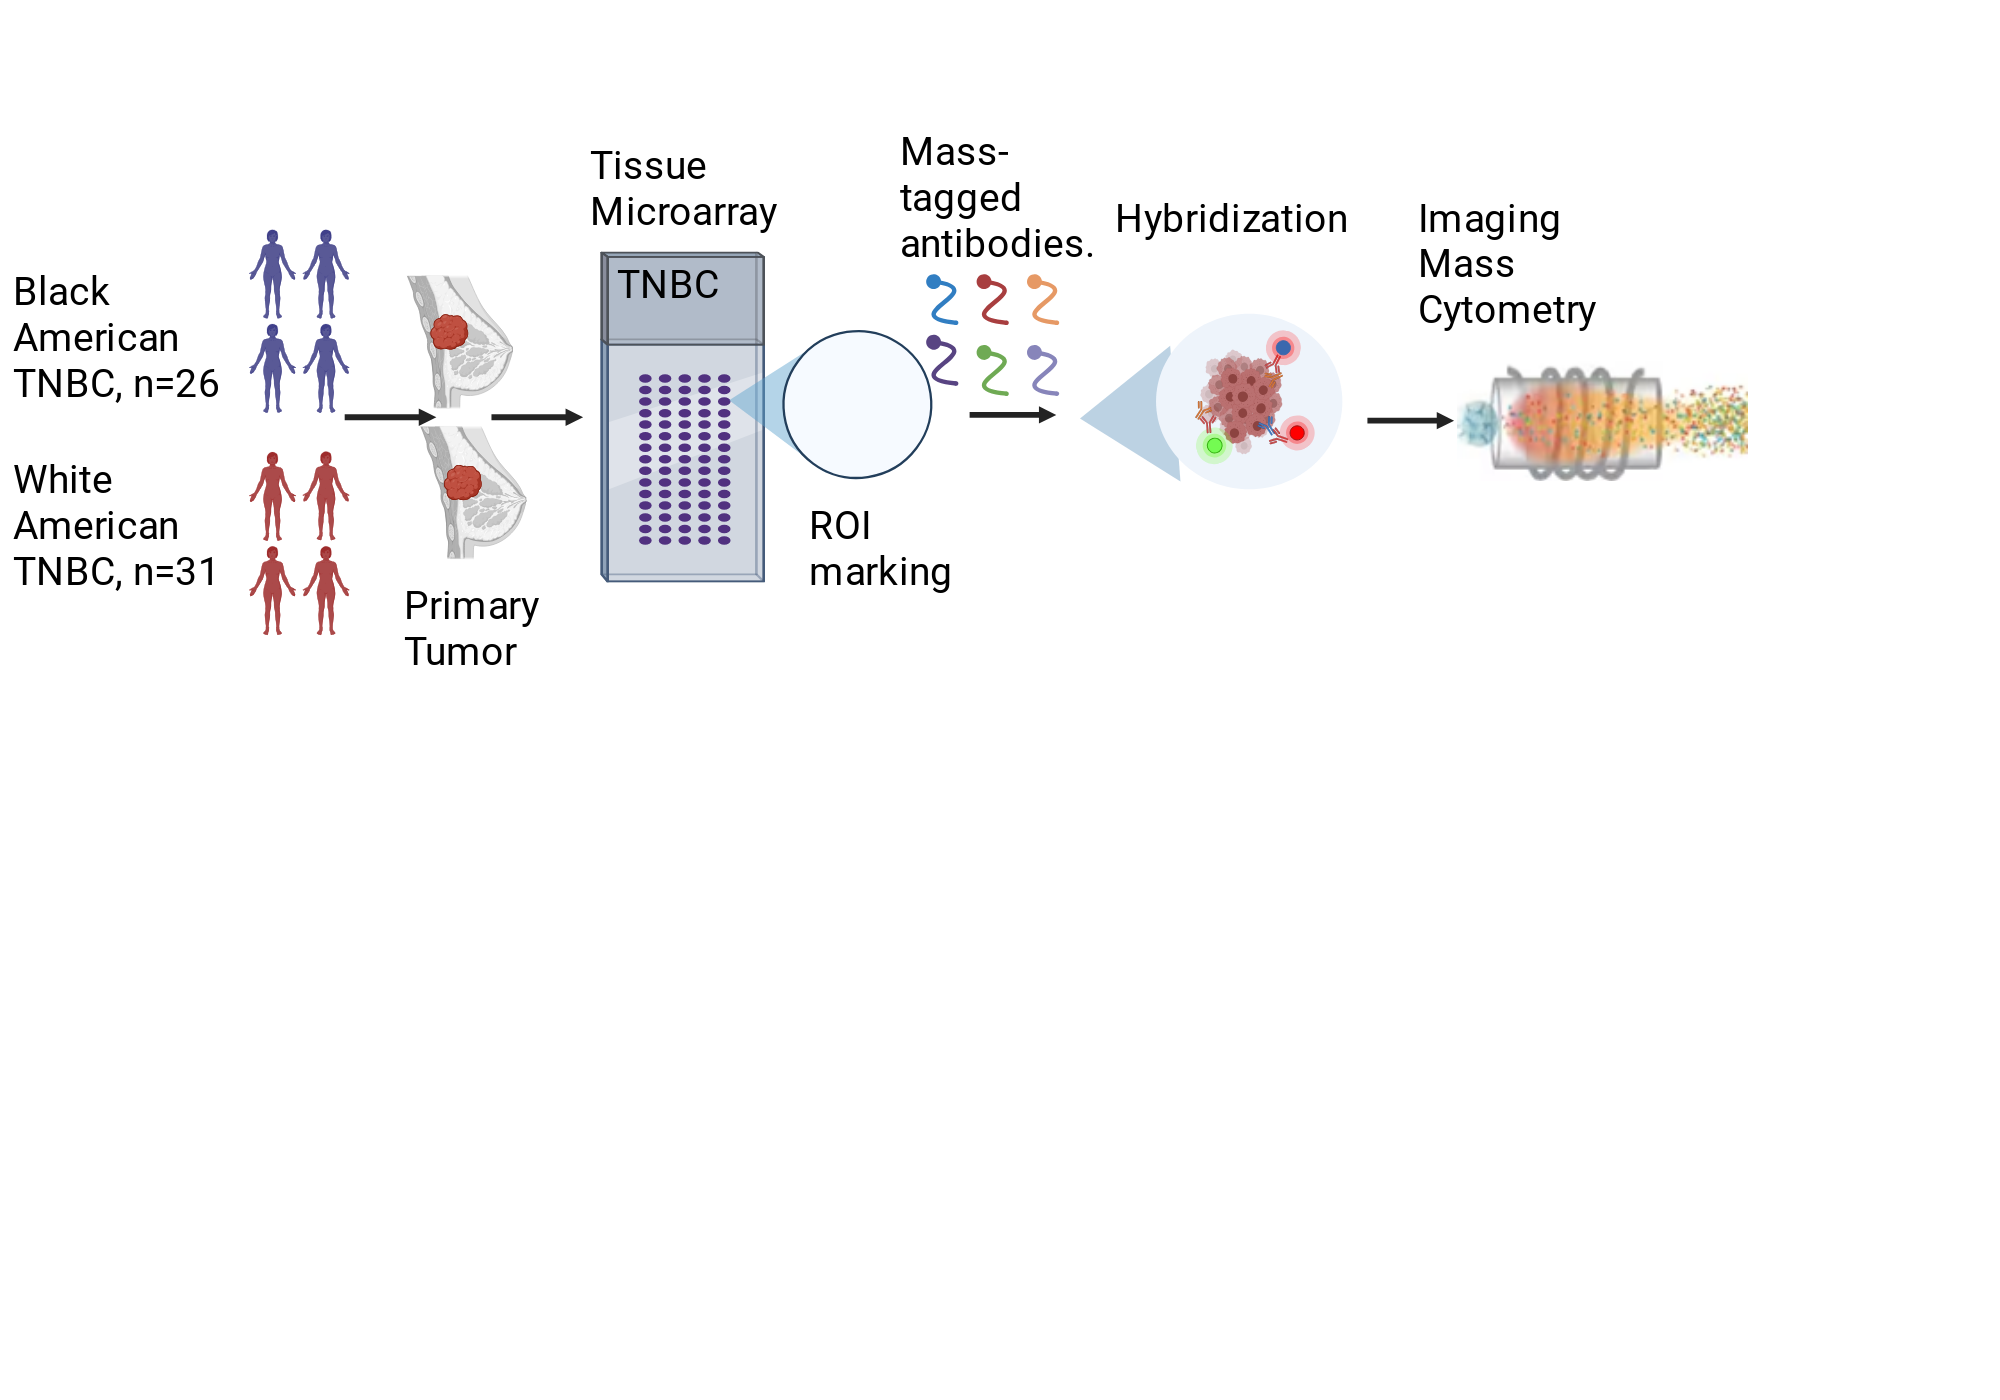
Diagram illustrating the imaging mass cytometry-based immune cell profiling process applied to BA and WA TNBC tumors, utilizing a tissue microarray (TMA) format.
Created in BioRender. Sreekumar, A. (2025) https://app.biorender.com/citation/680fe0df63e6d79c82257a83
Copy bibliographic reference (APA Style)
Sreekumar, A. (2025). Diagram illustrating the imaging mass cytometry-based immune cell profiling process applied to BA and WA TNBC tumors, utilizing a tissue microarray (TMA) format.. Created in BioRender. https://app.biorender.com/citation/680fe0df63e6d79c82257a83