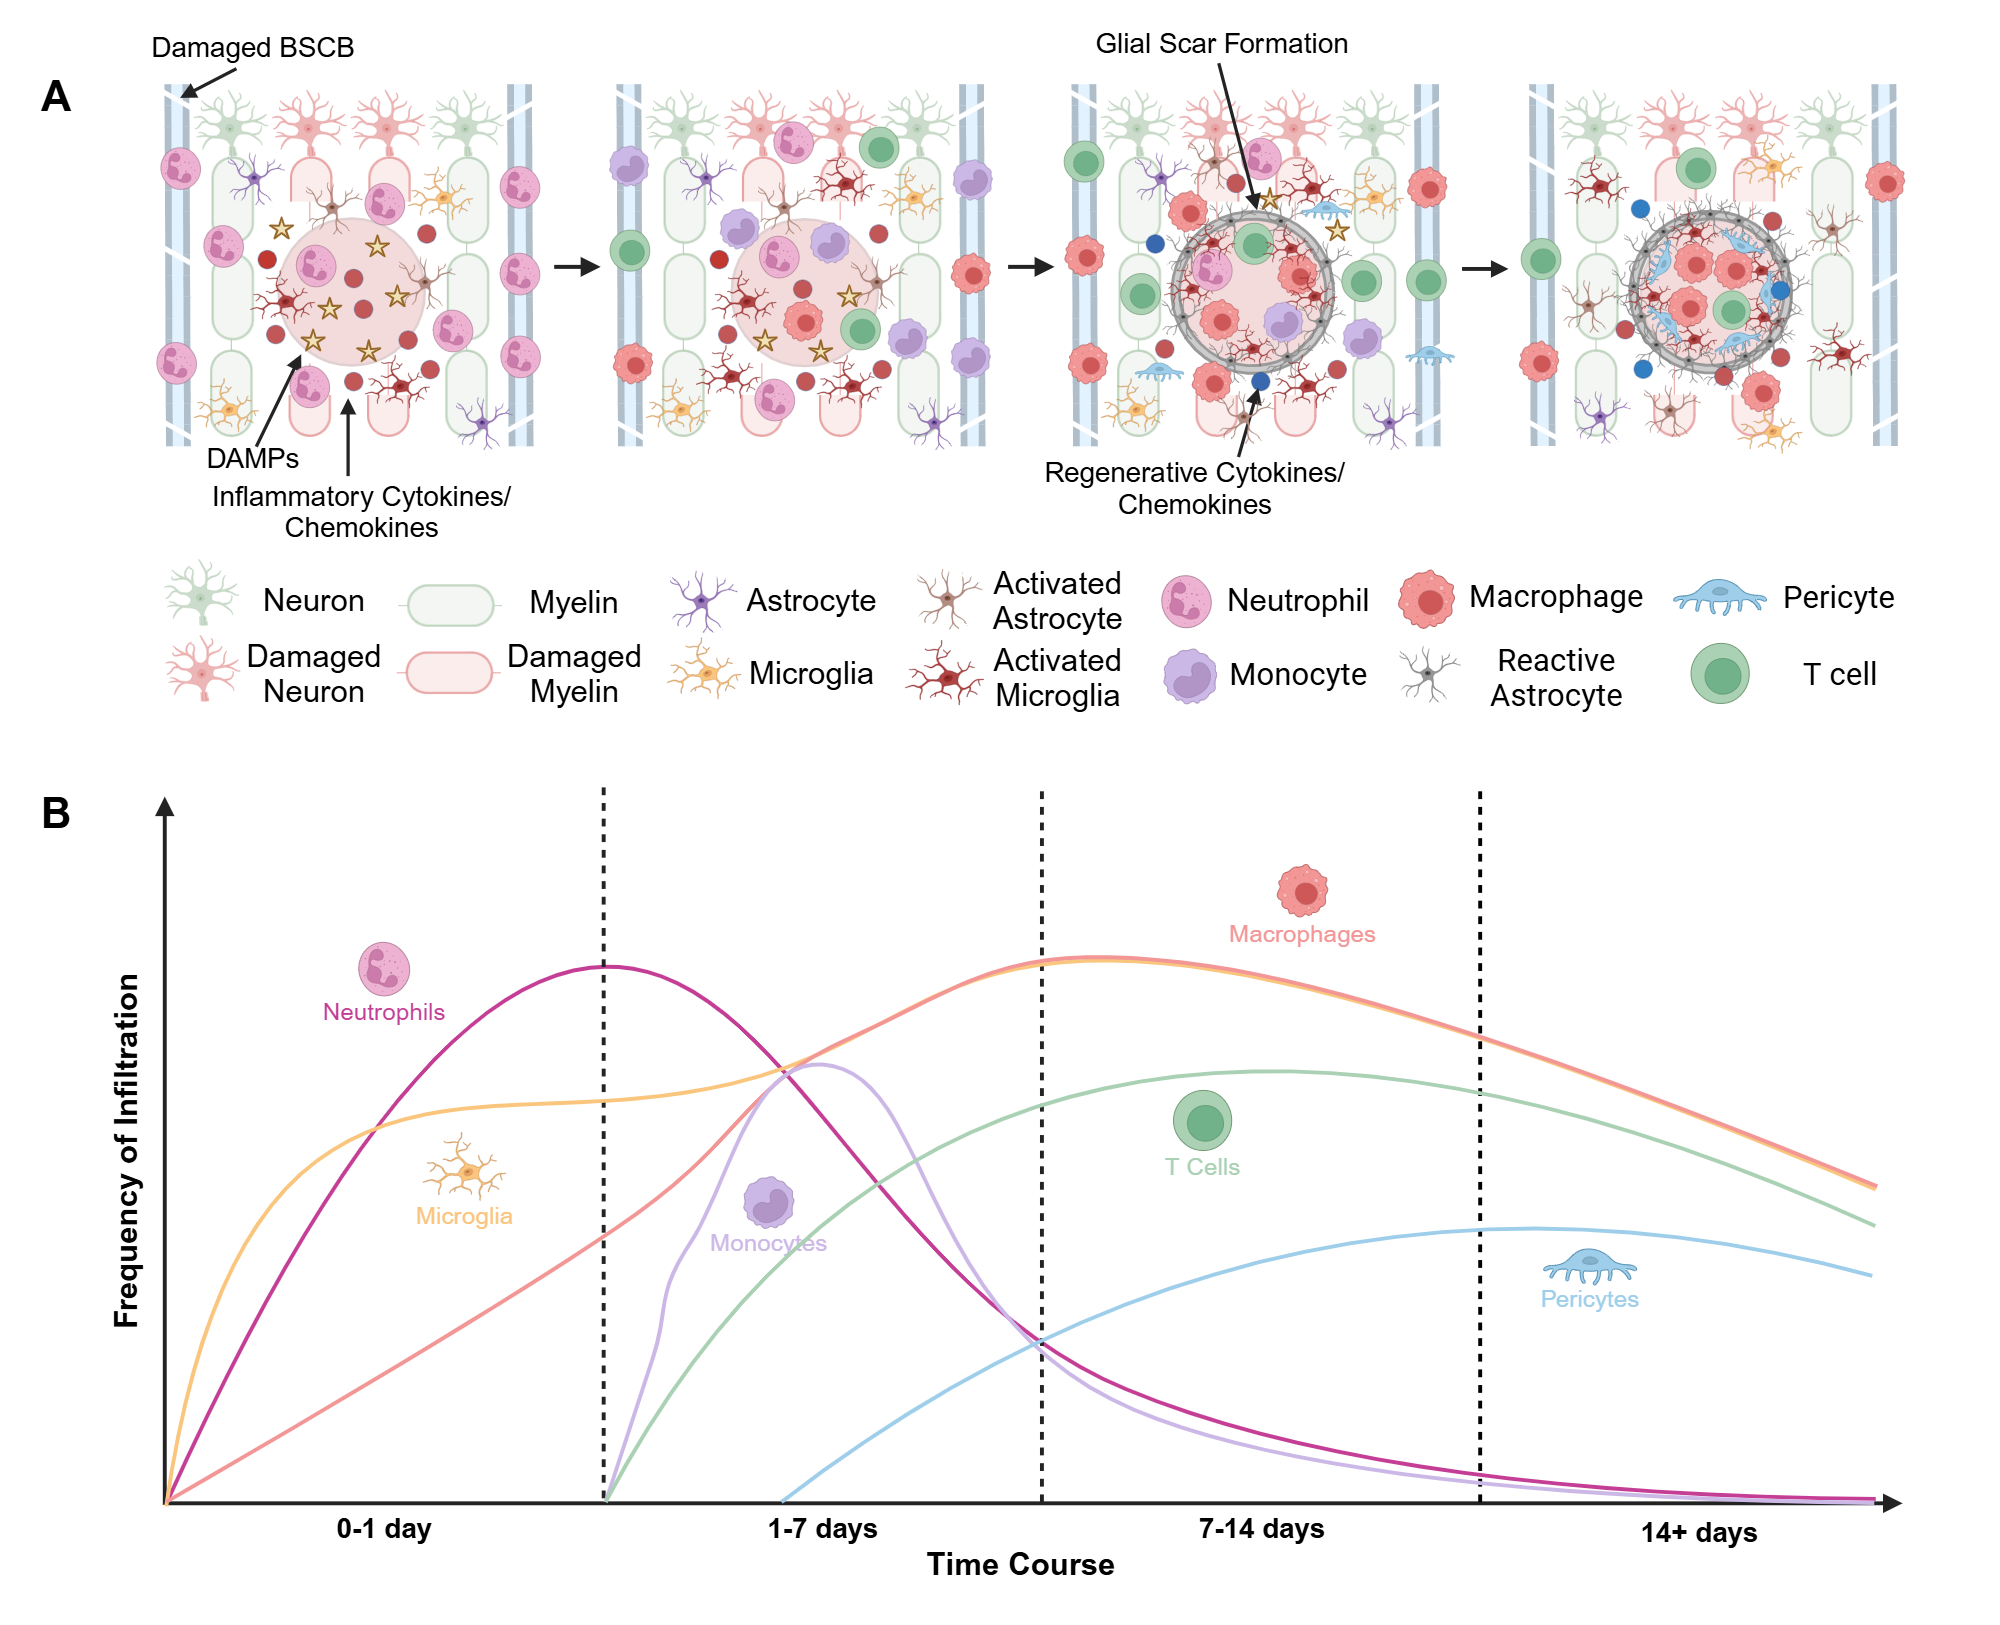
Figure 1 (a) Schematic depicting time course of SCI and infiltration of immune cells. (b) Graph illustrating the infiltration frequency of various immune cell populations over the time course of SCI.
Created in BioRender. Kolpek, D. (2024) https://app.biorender.com/citation/66eda45927caa716103cb6b2
Copy bibliographic reference (APA Style)
Kolpek, D. (2024). Figure 1 (a) Schematic depicting time course of SCI and infiltration of immune cells. (b) Graph illustrating the infiltration frequency of various immune cell populations over the time course of SCI.. Created in BioRender. https://app.biorender.com/citation/66eda45927caa716103cb6b2