Figure 1. Percent Change in Weight, Whole Body BMD, CTX, and P1NP from Baseline to 5 Months. Created with GraphPad Prism and BioRender.

eye open icon
View-only
chevron left icon
chevron right icon
chevron left icon
chevron right icon
No items found.

This figure is created in BioRender. Create your own professional science figure now!

Explore BioRender’s library of over 50,000 pre-made icons and templates from more than 30 fields of life sciences.
Try it now
Published figure
Link to publication coming soon
View in
chevron right icon

Description

No description has been provided for this figure.

No description

Confirmation of the Author’s Publication and Licensing Rights

No confirmation has been provided for this figure.

How to cite this figure

text snippet icon
Copy in-text citation
Created in BioRender. Beavers, K. (2025) https://app.biorender.com/citation/68126f9329d4074d5a546a90
text snippet icon
Copy bibliographic reference (APA Style)
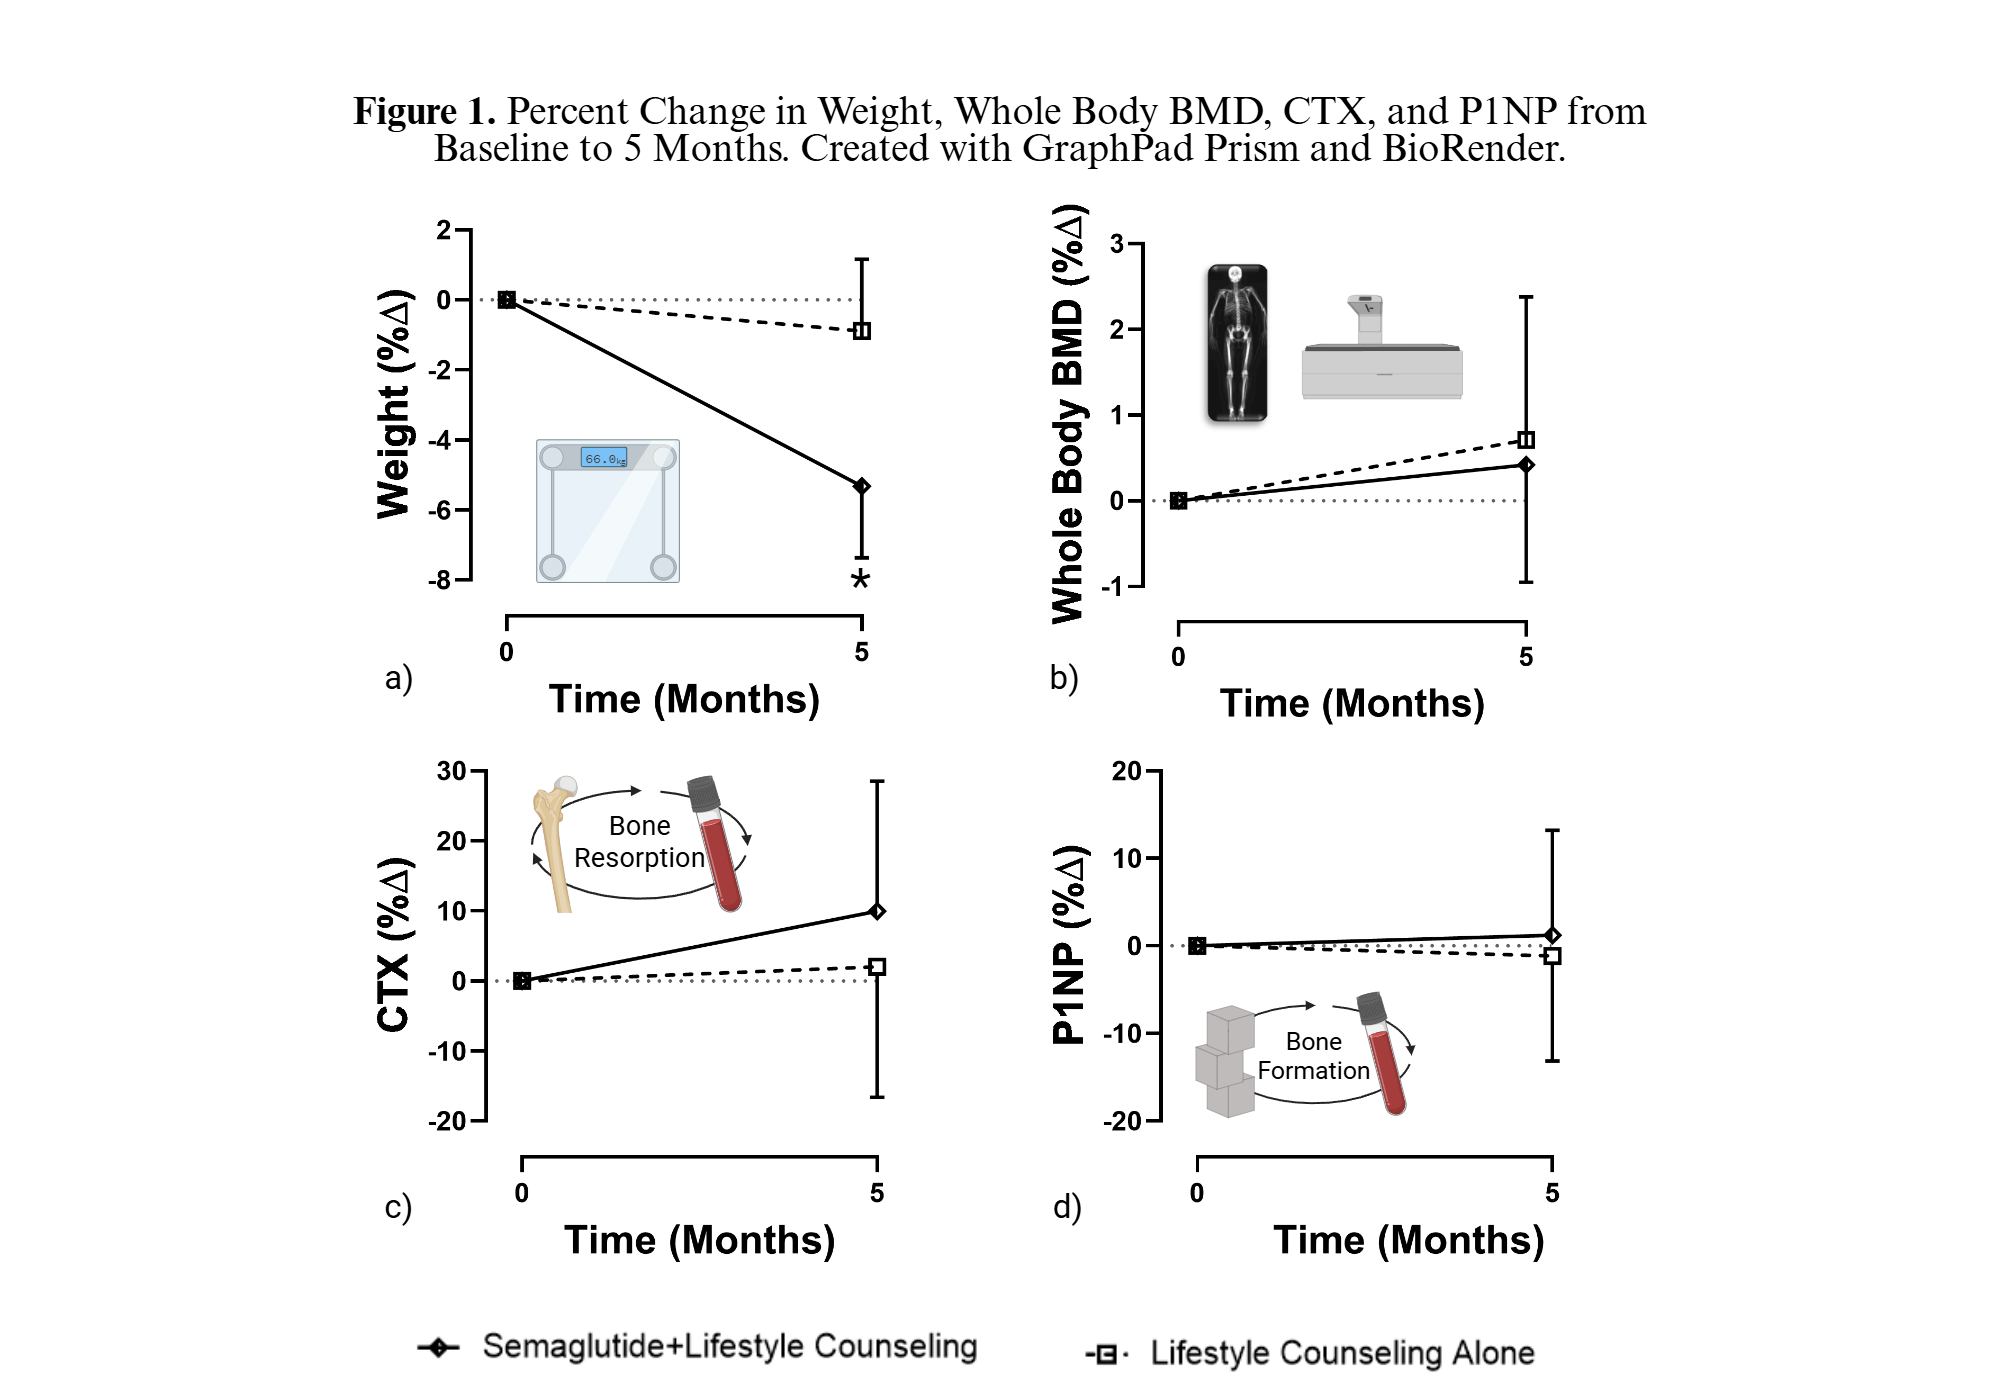
Beavers, K. (2025). Figure 1. Percent Change in Weight, Whole Body BMD, CTX, and P1NP from Baseline to 5 Months. Created with GraphPad Prism and BioRender.. Created in BioRender. https://app.biorender.com/citation/68126f9329d4074d5a546a90

How to use this figure

Show More
Show Less