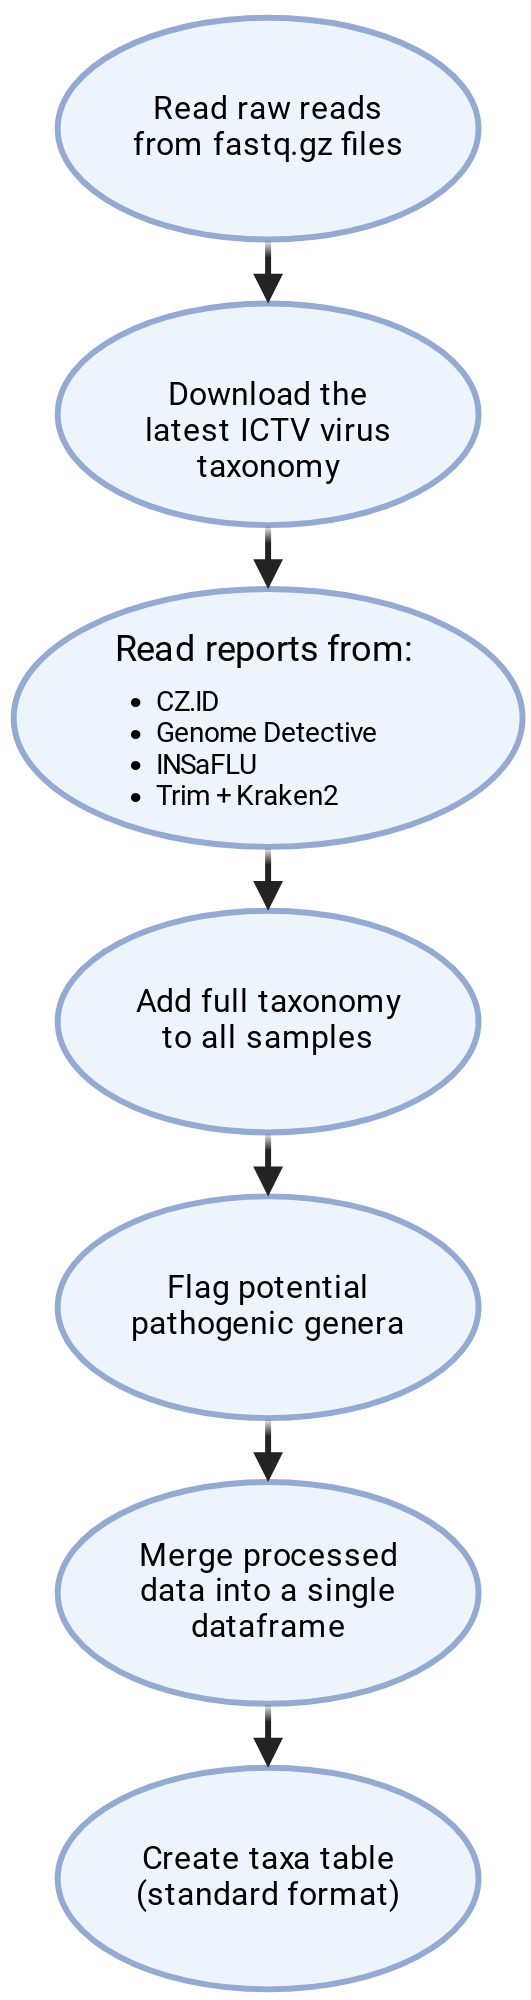
Figure 3 - Fluxogram of the Python script for processing and analyses of the reports generated by the different software pipelines. Taxa - Operational Taxonomic Unit.
Created in BioRender. Santos, A. (2025) https://app.biorender.com/citation/67af283d22800b8f50d0f546
Copy bibliographic reference (APA Style)
Santos, A. (2025). Figure 3 - Fluxogram of the Python script for processing and analyses of the reports generated by the different software pipelines. Taxa - Operational Taxonomic Unit.. Created in BioRender. https://app.biorender.com/citation/67af283d22800b8f50d0f546