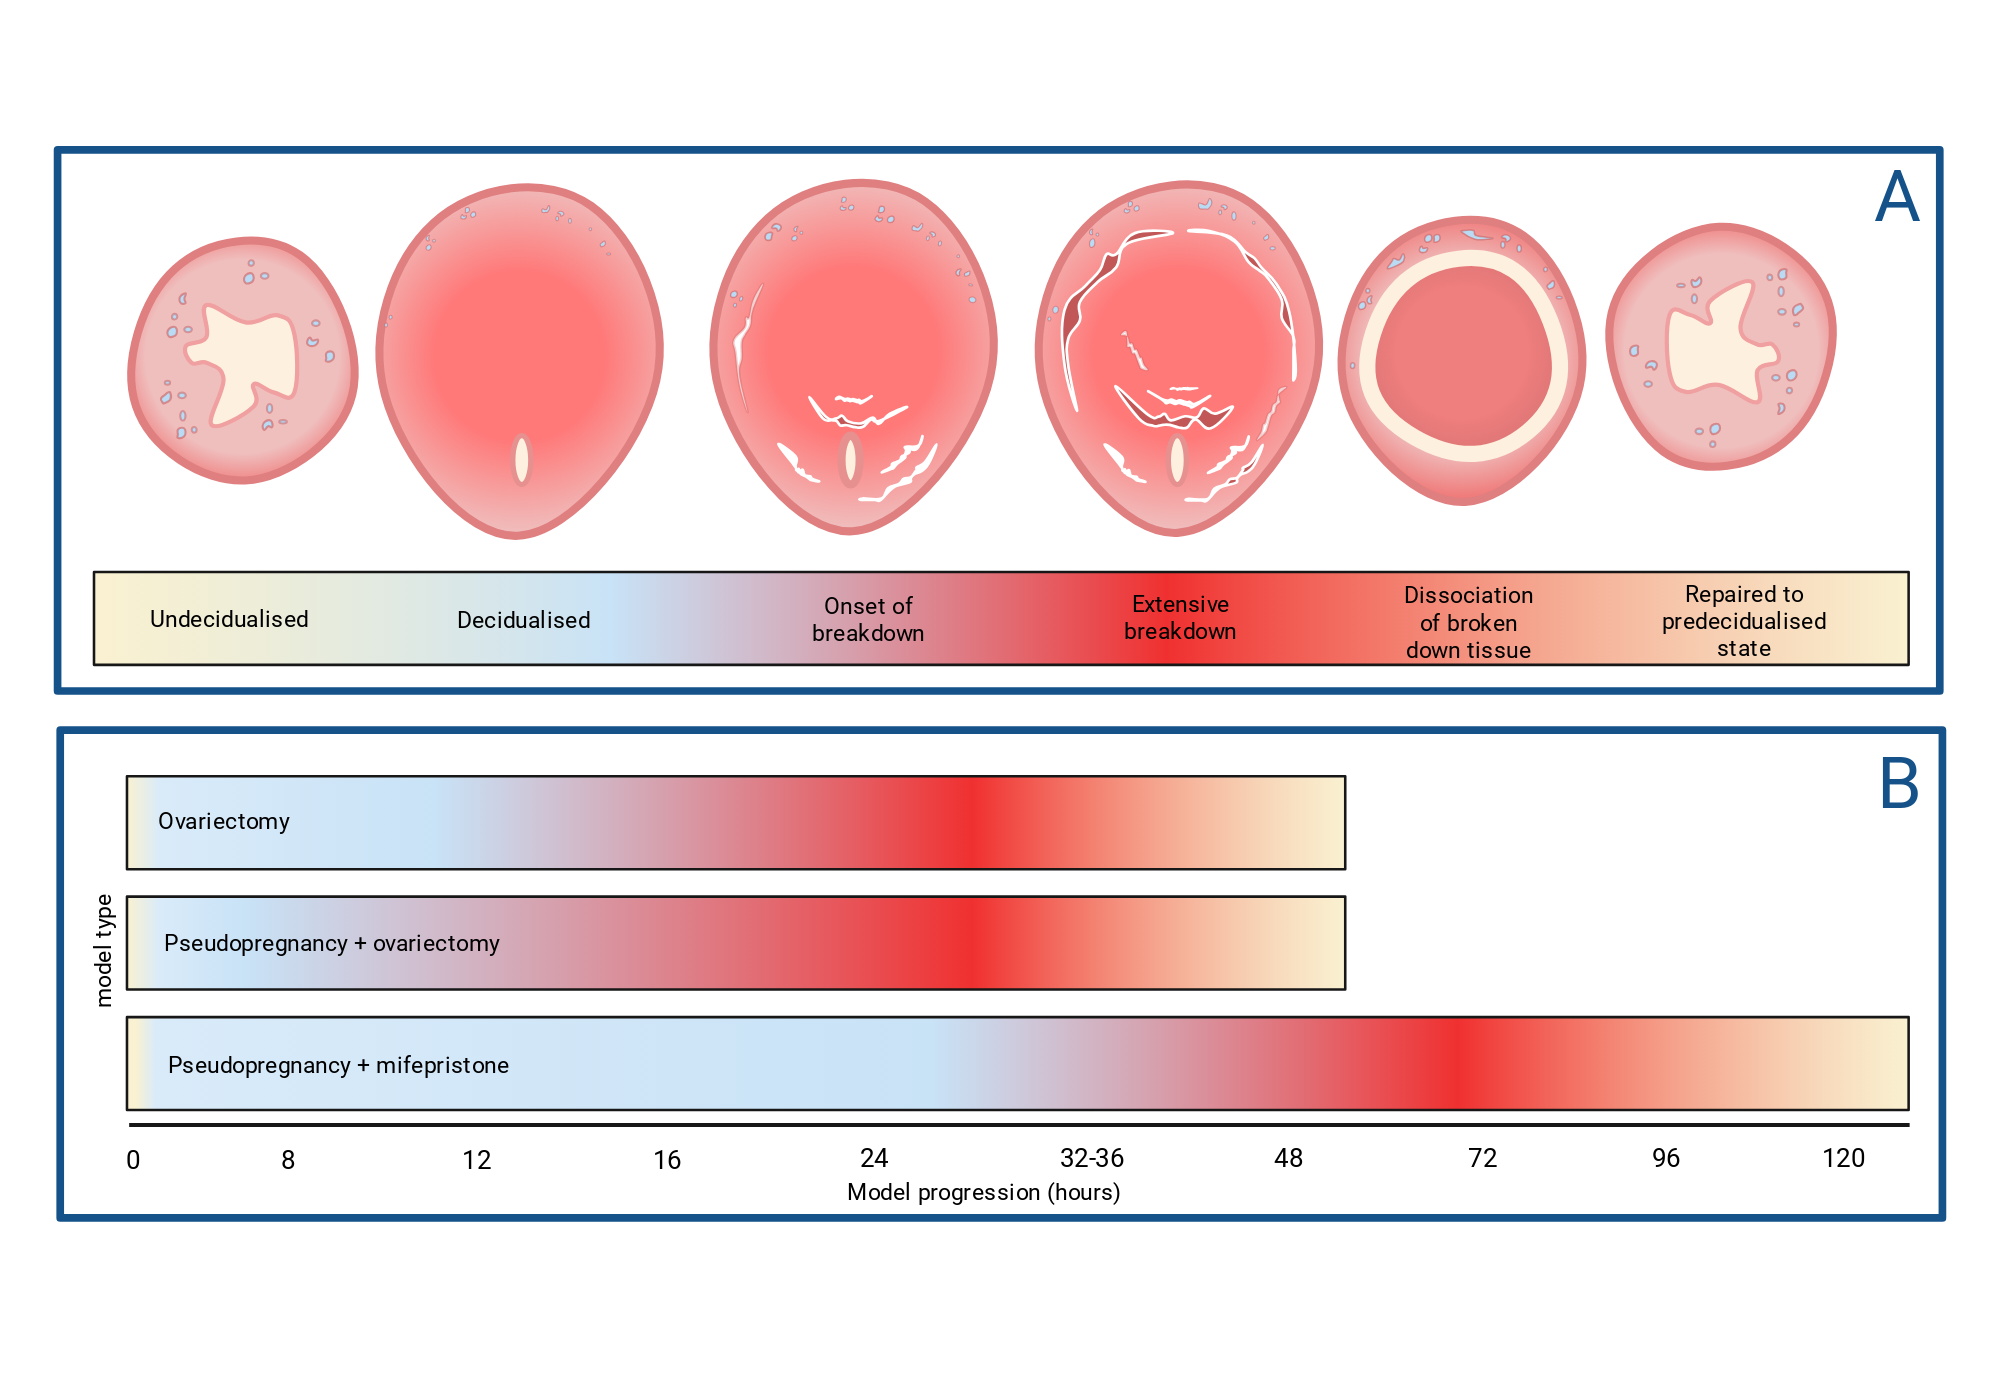
Figure 3. (A) Schematic of mouse uterus cross section during induced menstrual breakdown. (B) Model breakdown progression timelines of the different models.
Created in BioRender. Rogers, L. (2025) https://app.biorender.com/citation/67d9e6d4a1adb7d2426d9f62
Copy bibliographic reference (APA Style)
Rogers, L. (2025). Figure 3. (A) Schematic of mouse uterus cross section during induced menstrual breakdown. (B) Model breakdown progression timelines of the different models.. Created in BioRender. https://app.biorender.com/citation/67d9e6d4a1adb7d2426d9f62