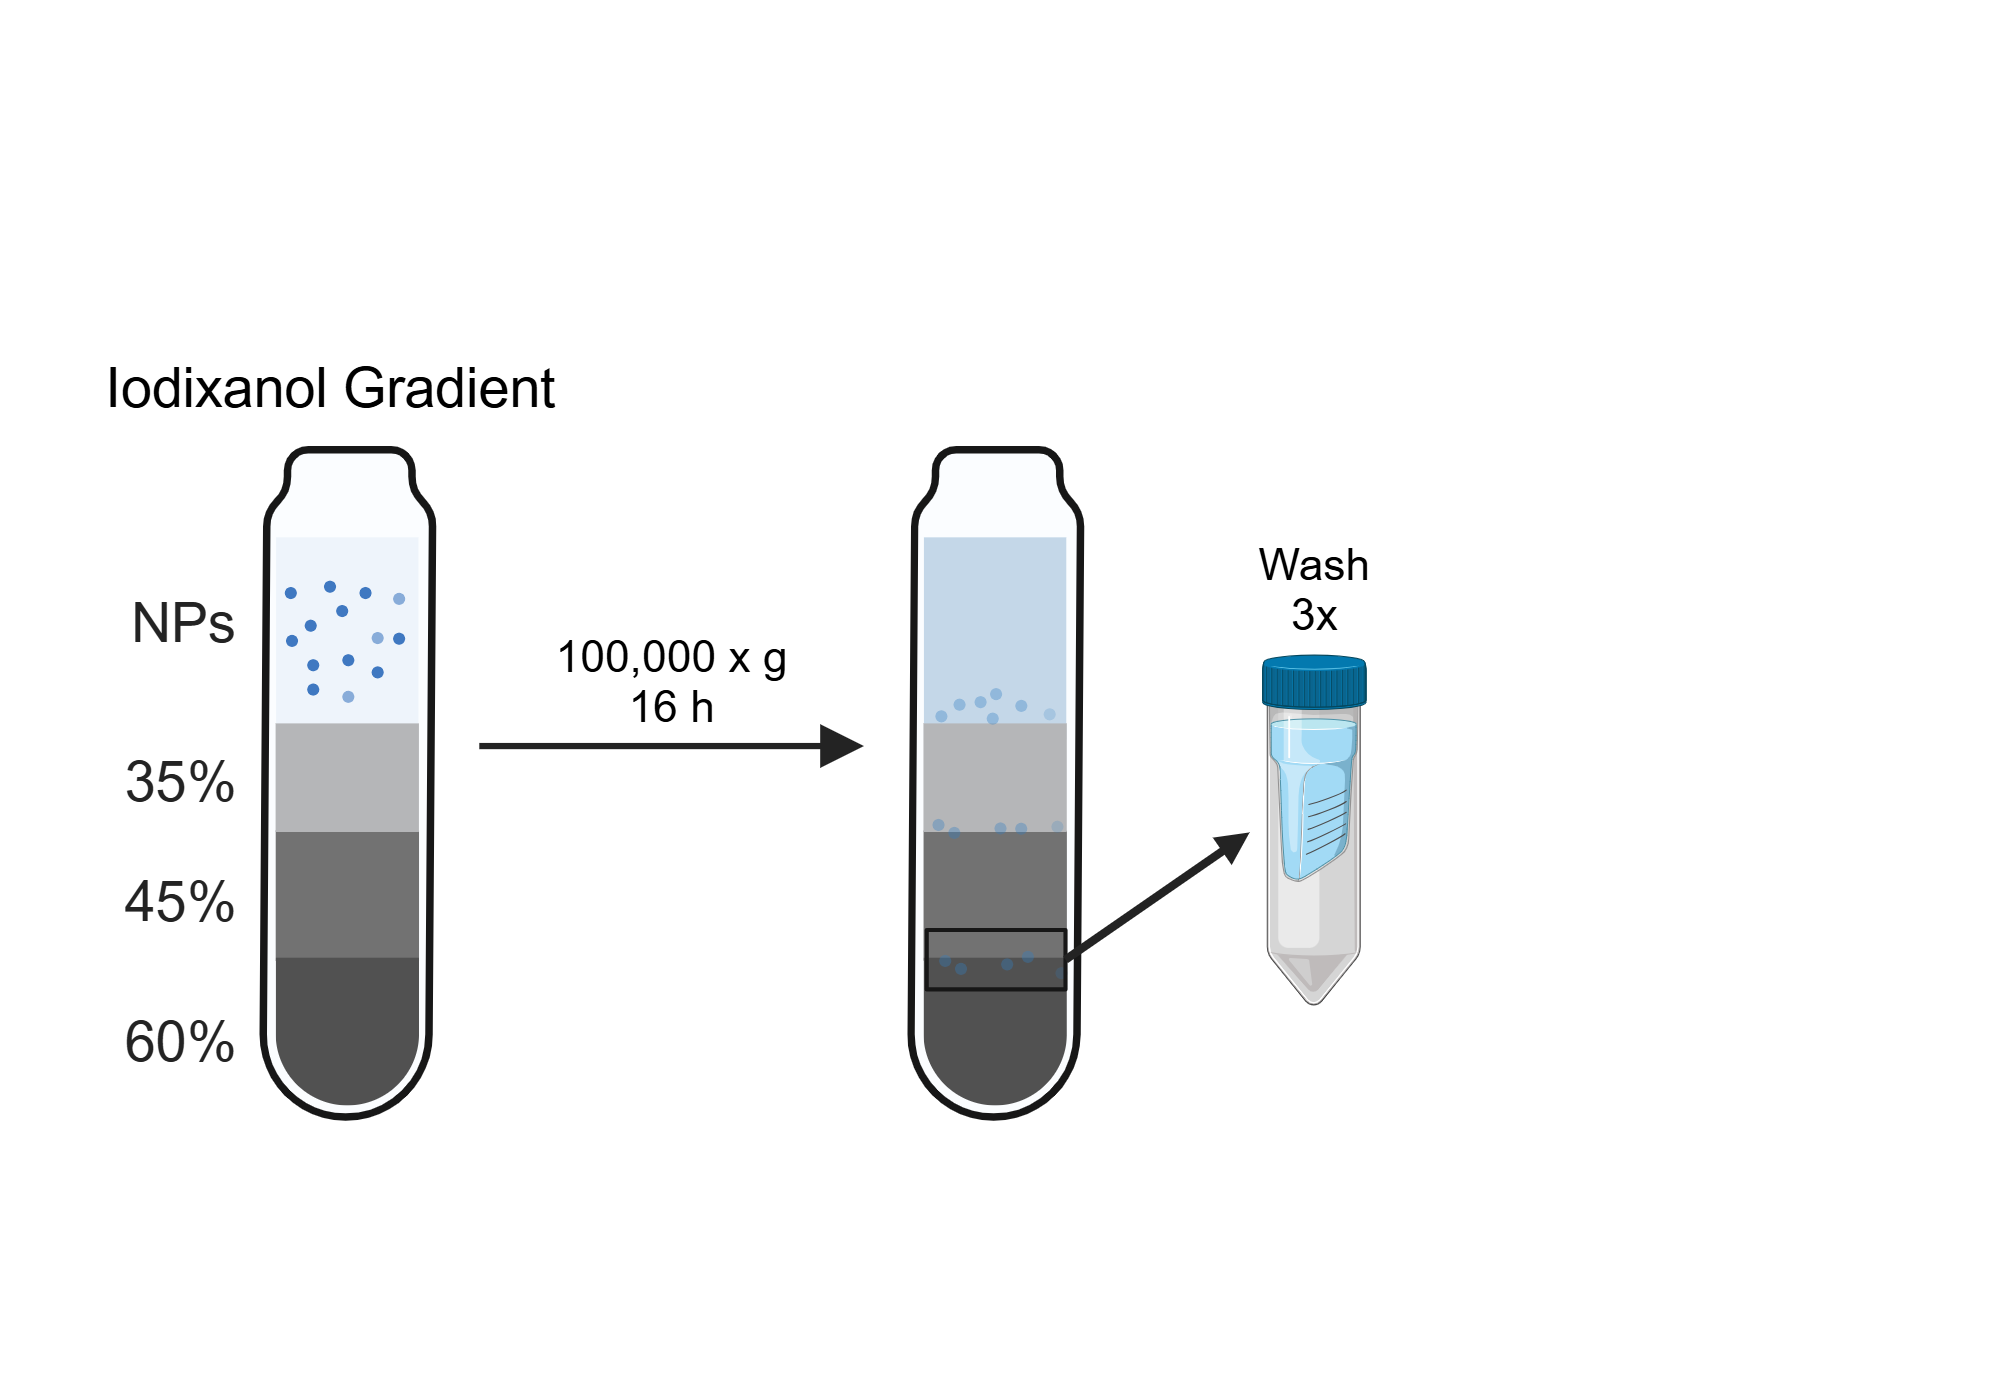
Figure 4. Method and characterization of DiD NPs purified by DGC. (A) Scheme of purification process. (B) TEM of DiD NPs after DGC. (C) Hydrodynamic diameter, zeta potential, and fluorescence of filtered DiD NPs before versus after DGC.
Created in BioRender. Sterin, E. (2025) https://app.biorender.com/citation/67cb11c0b9e9effae0d4de16
Copy bibliographic reference (APA Style)
Sterin, E. (2025). Figure 4. Method and characterization of DiD NPs purified by DGC. (A) Scheme of purification process. (B) TEM of DiD NPs after DGC. (C) Hydrodynamic diameter, zeta potential, and fluorescence of filtered DiD NPs before versus after DGC.. Created in BioRender. https://app.biorender.com/citation/67cb11c0b9e9effae0d4de16