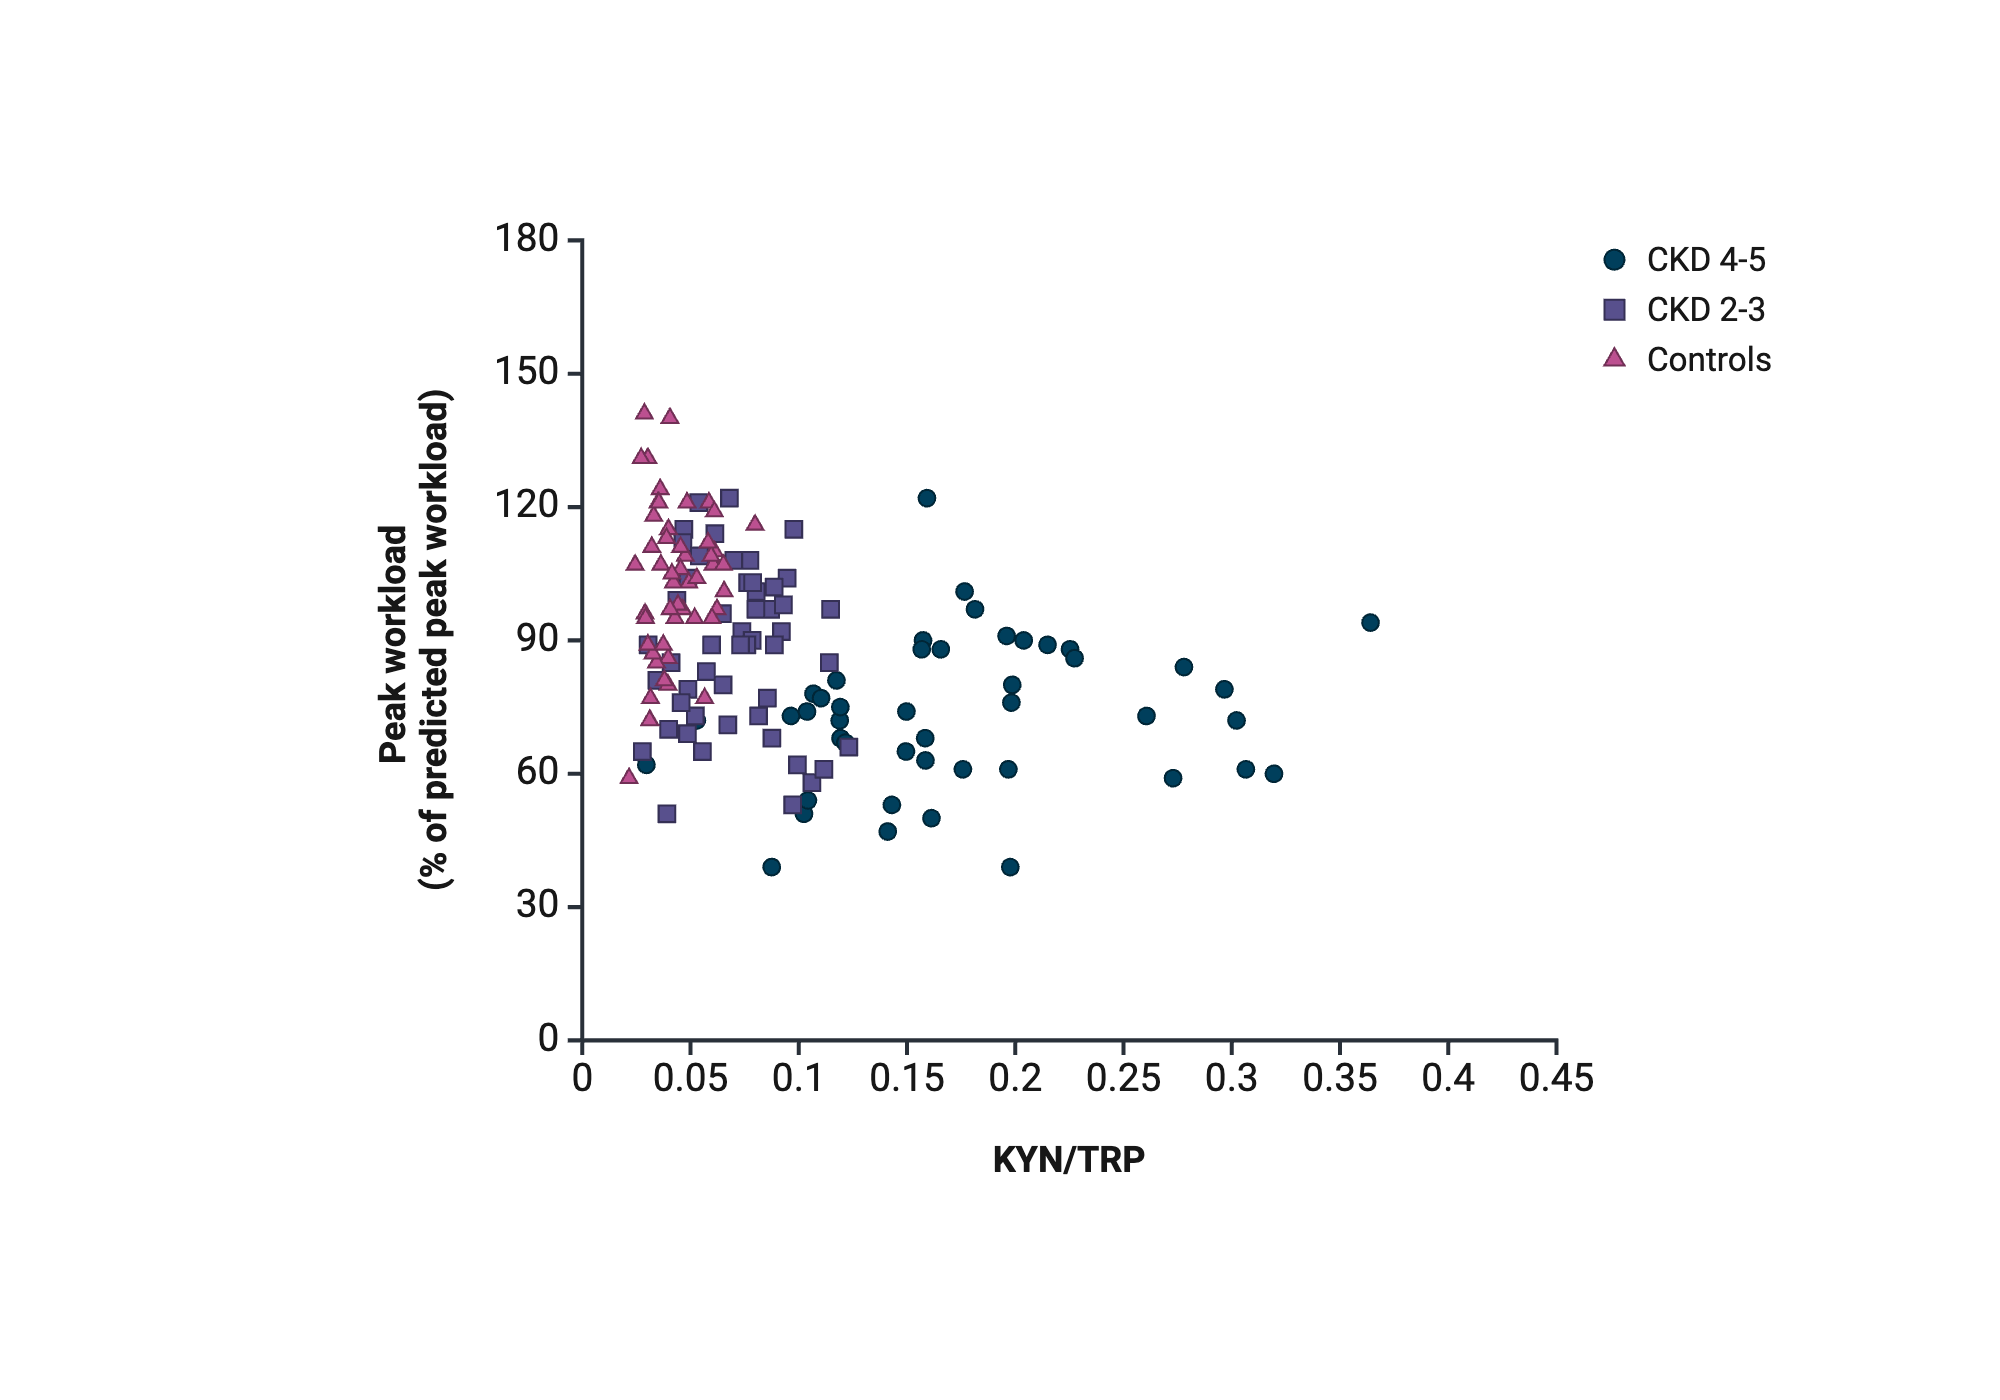
Figure 4. The relationship between aerobic exercise capacity expressed as peak workload as a percentage of predicted peak workload and KYN/TRP ratio, divided by CKD 2-3, CKD 4-5 and controls.
Created in BioRender. Wallin, H. (2025) https://app.biorender.com/citation/676532dcff8b005e898251c7
Copy bibliographic reference (APA Style)
Wallin, H. (2025). Figure 4. The relationship between aerobic exercise capacity expressed as peak workload as a percentage of predicted peak workload and KYN/TRP ratio, divided by CKD 2-3, CKD 4-5 and controls.. Created in BioRender. https://app.biorender.com/citation/676532dcff8b005e898251c7