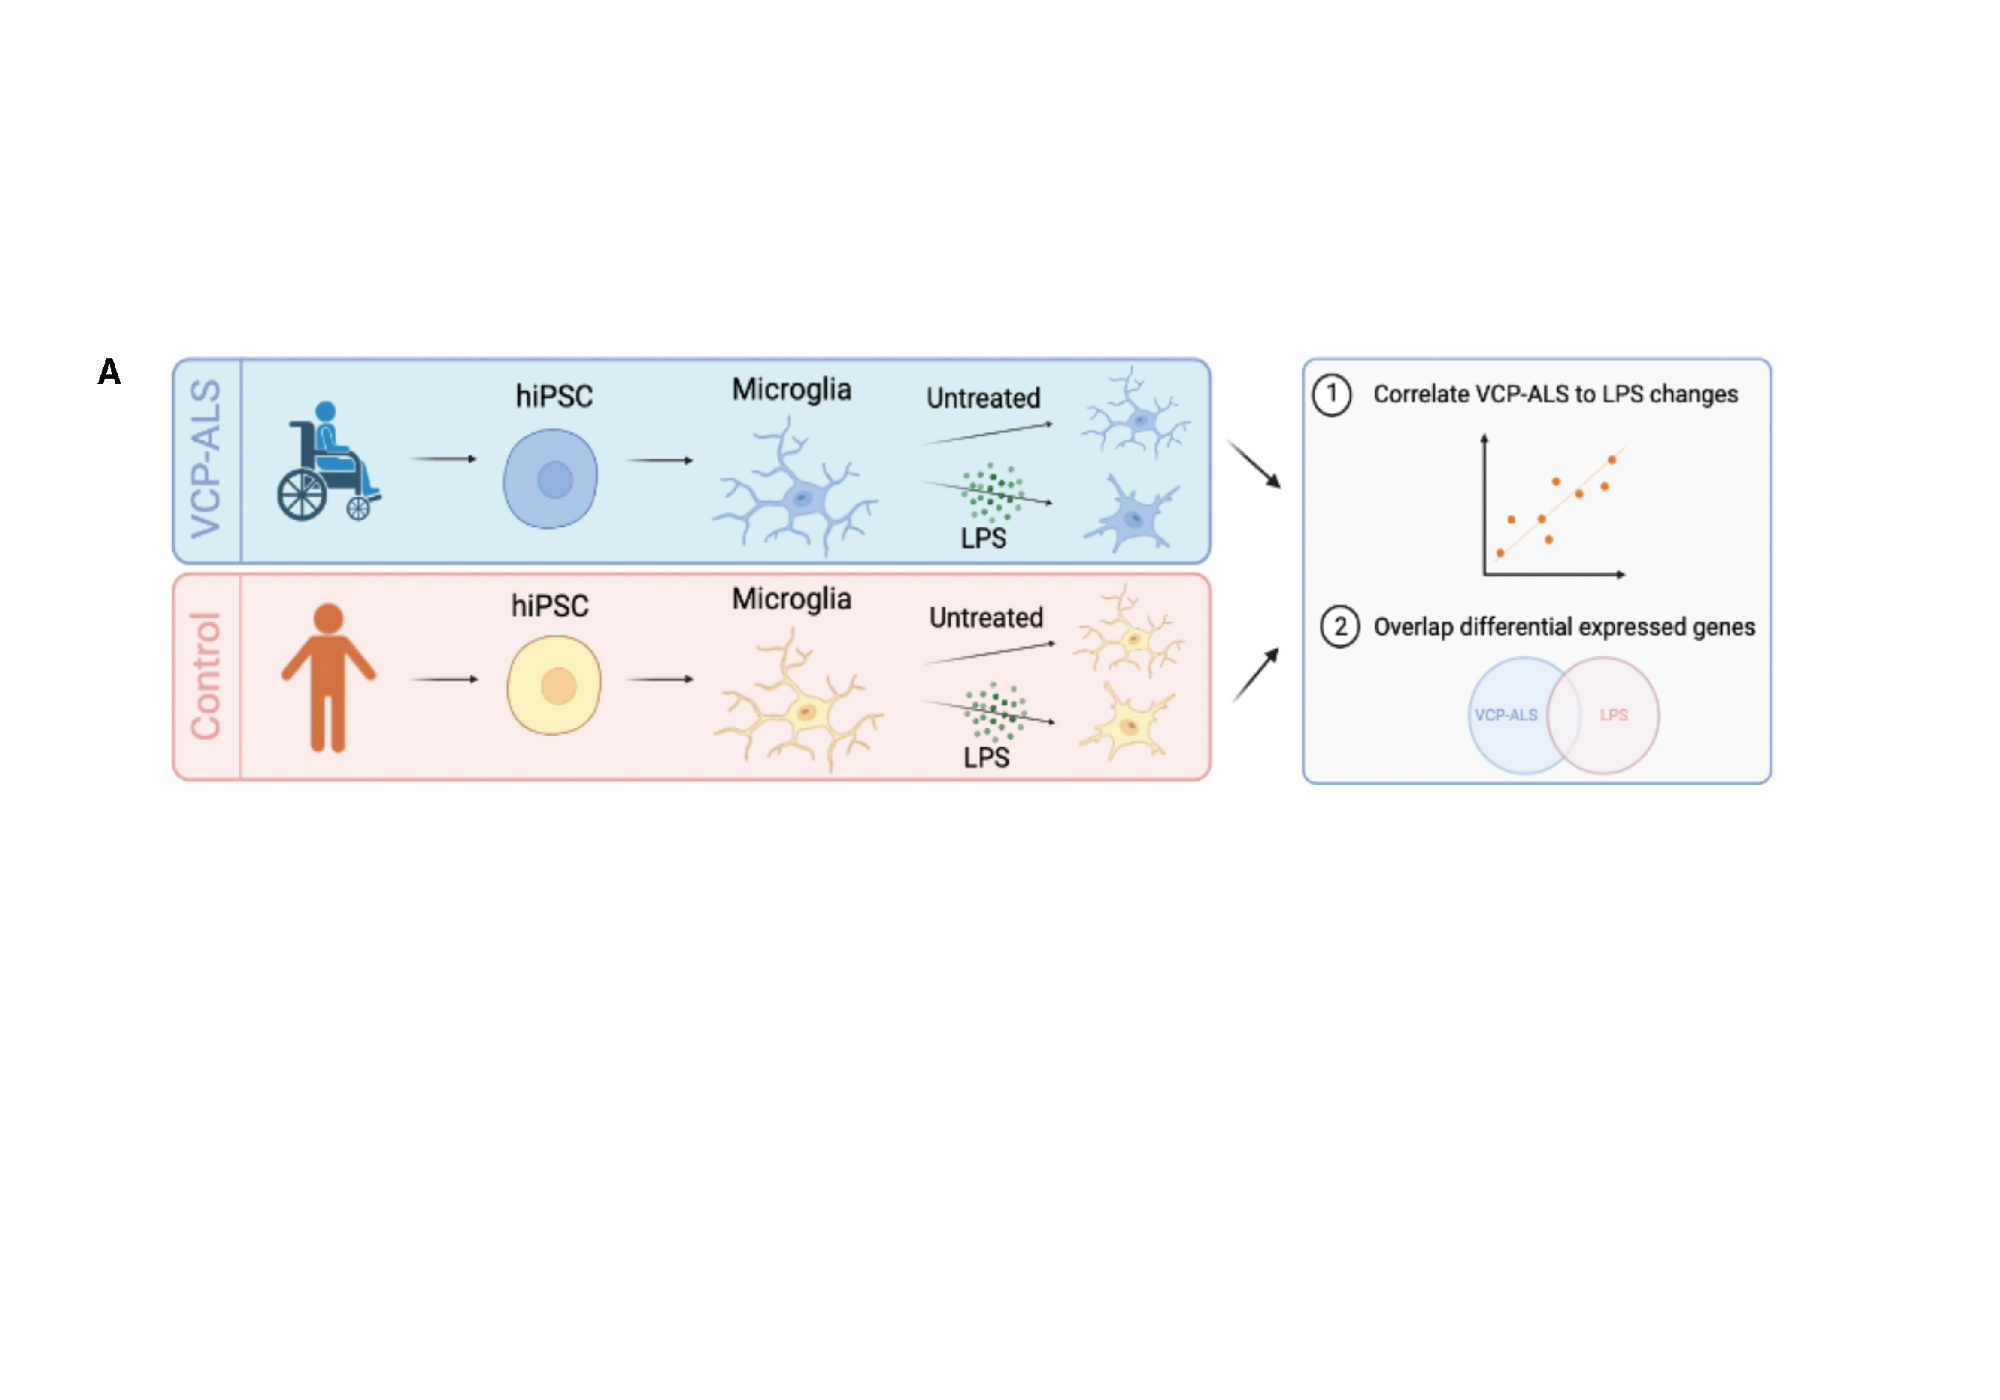
Figure 4: VCP mutant microglia show partial overlap with LPS-stimulated healthy control microglia. (A) Schematic showing treatment of healthy control and VCP mutant microglia with LPS and downstream RNA-seq and mass spectroscopy analysis and comparison.
Created in BioRender. Clarke, B. (2024) https://app.biorender.com/citation/671a59a032ad294c2a1b8dbe
Copy bibliographic reference (APA Style)
Clarke, B. (2024). Figure 4: VCP mutant microglia show partial overlap with LPS-stimulated healthy control microglia. (A) Schematic showing treatment of healthy control and VCP mutant microglia with LPS and downstream RNA-seq and mass spectroscopy analysis and comparison.. Created in BioRender. https://app.biorender.com/citation/671a59a032ad294c2a1b8dbe