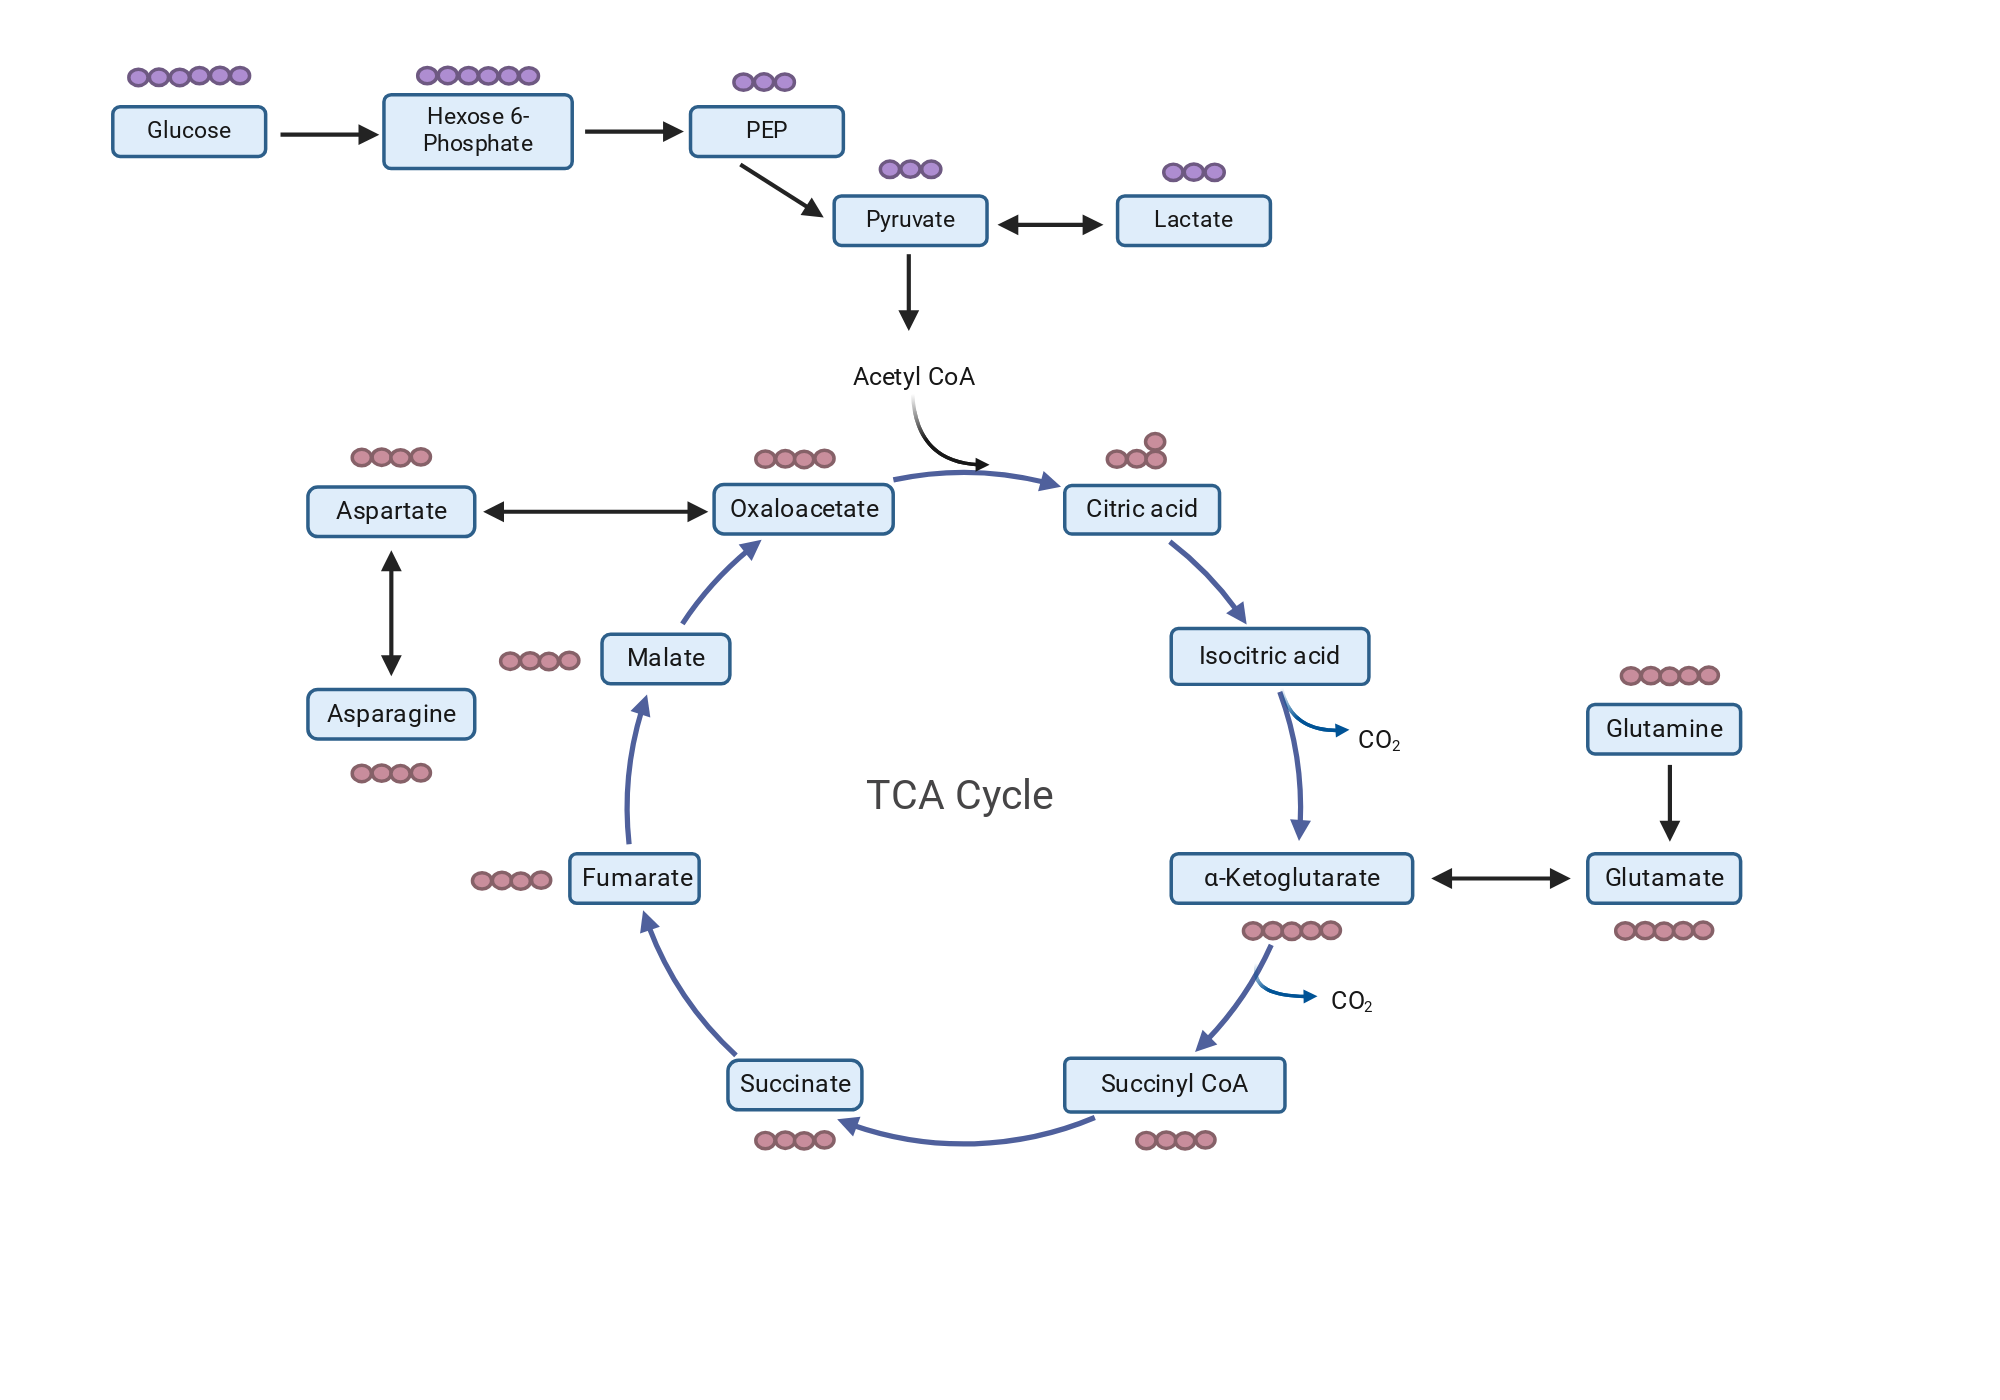
Figure EV3A: Schematic for tracing 13C5-glutamine or 13C6-glucose carbons through glycolysis and the TCA cycle in polyclonal HCC1806 and MDA-MB-231 NC and A2KO cells.
Created in BioRender. Wahi, K. (2024) https://app.biorender.com/citation/66e78ee328d2b2ad54c86901
Copy bibliographic reference (APA Style)
Wahi, K. (2024). Figure EV3A: Schematic for tracing 13C5-glutamine or 13C6-glucose carbons through glycolysis and the TCA cycle in polyclonal HCC1806 and MDA-MB-231 NC and A2KO cells.. Created in BioRender. https://app.biorender.com/citation/66e78ee328d2b2ad54c86901