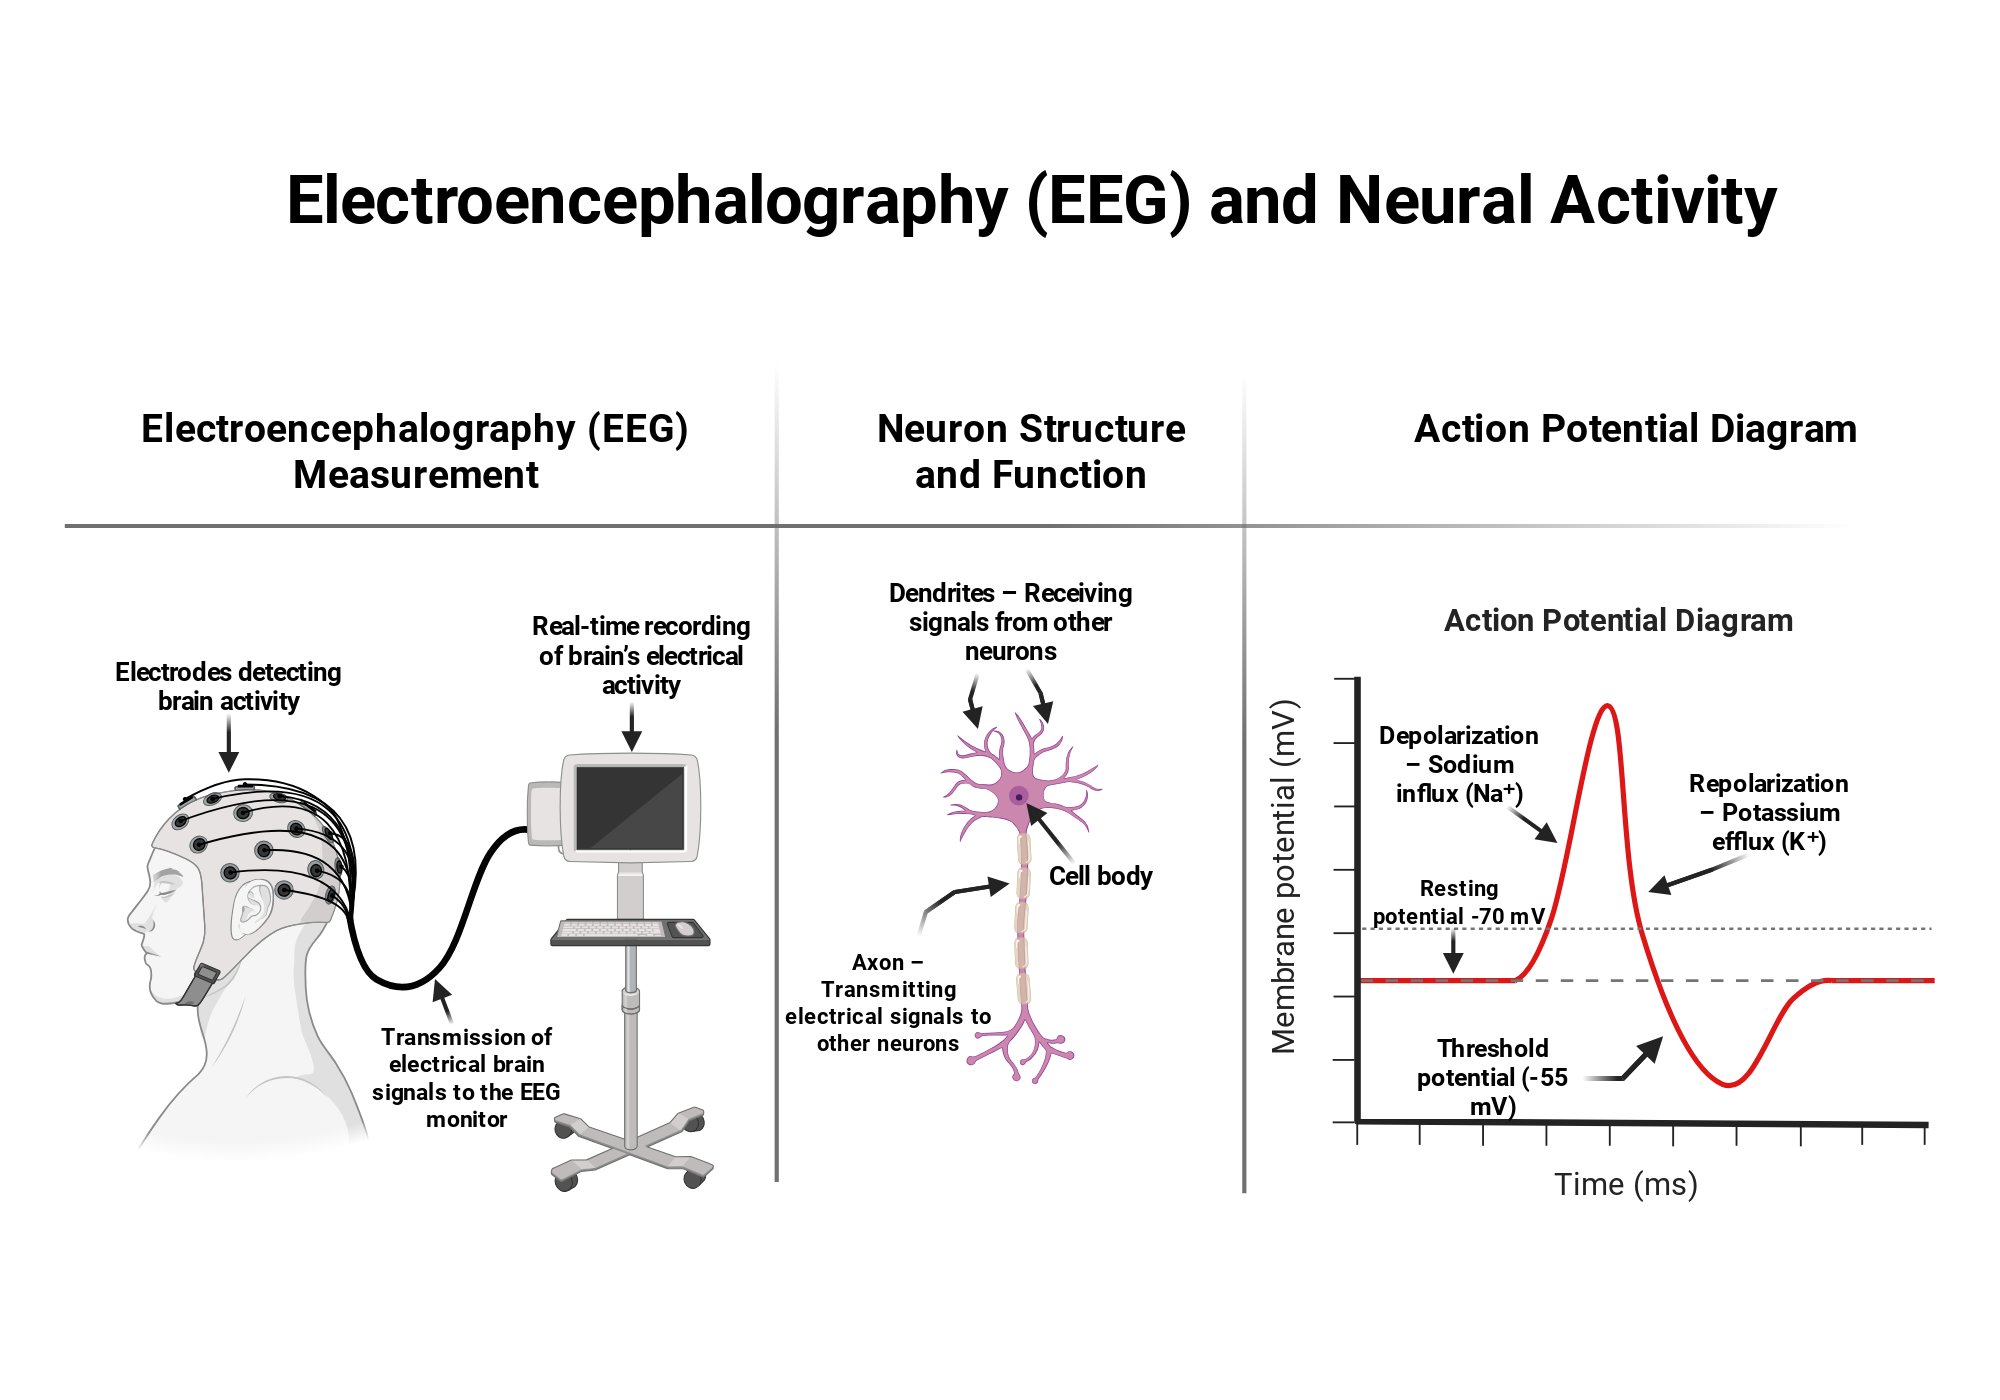
Schematic representation of EEG measurement, neuron structure, and the action potential process. The diagram illustrates how brain activity is recorded via EEG and highlights the electrophysiological mechanisms underlying neural communication.
Created in BioRender. Sarzyńska, I. (2025) https://app.biorender.com/citation/67f59bcbb4be6a38222b0caa
Copy bibliographic reference (APA Style)
Sarzyńska, I. (2025). Schematic representation of EEG measurement, neuron structure, and the action potential process. The diagram illustrates how brain activity is recorded via EEG and highlights the electrophysiological mechanisms underlying neural communication.. Created in BioRender. https://app.biorender.com/citation/67f59bcbb4be6a38222b0caa