

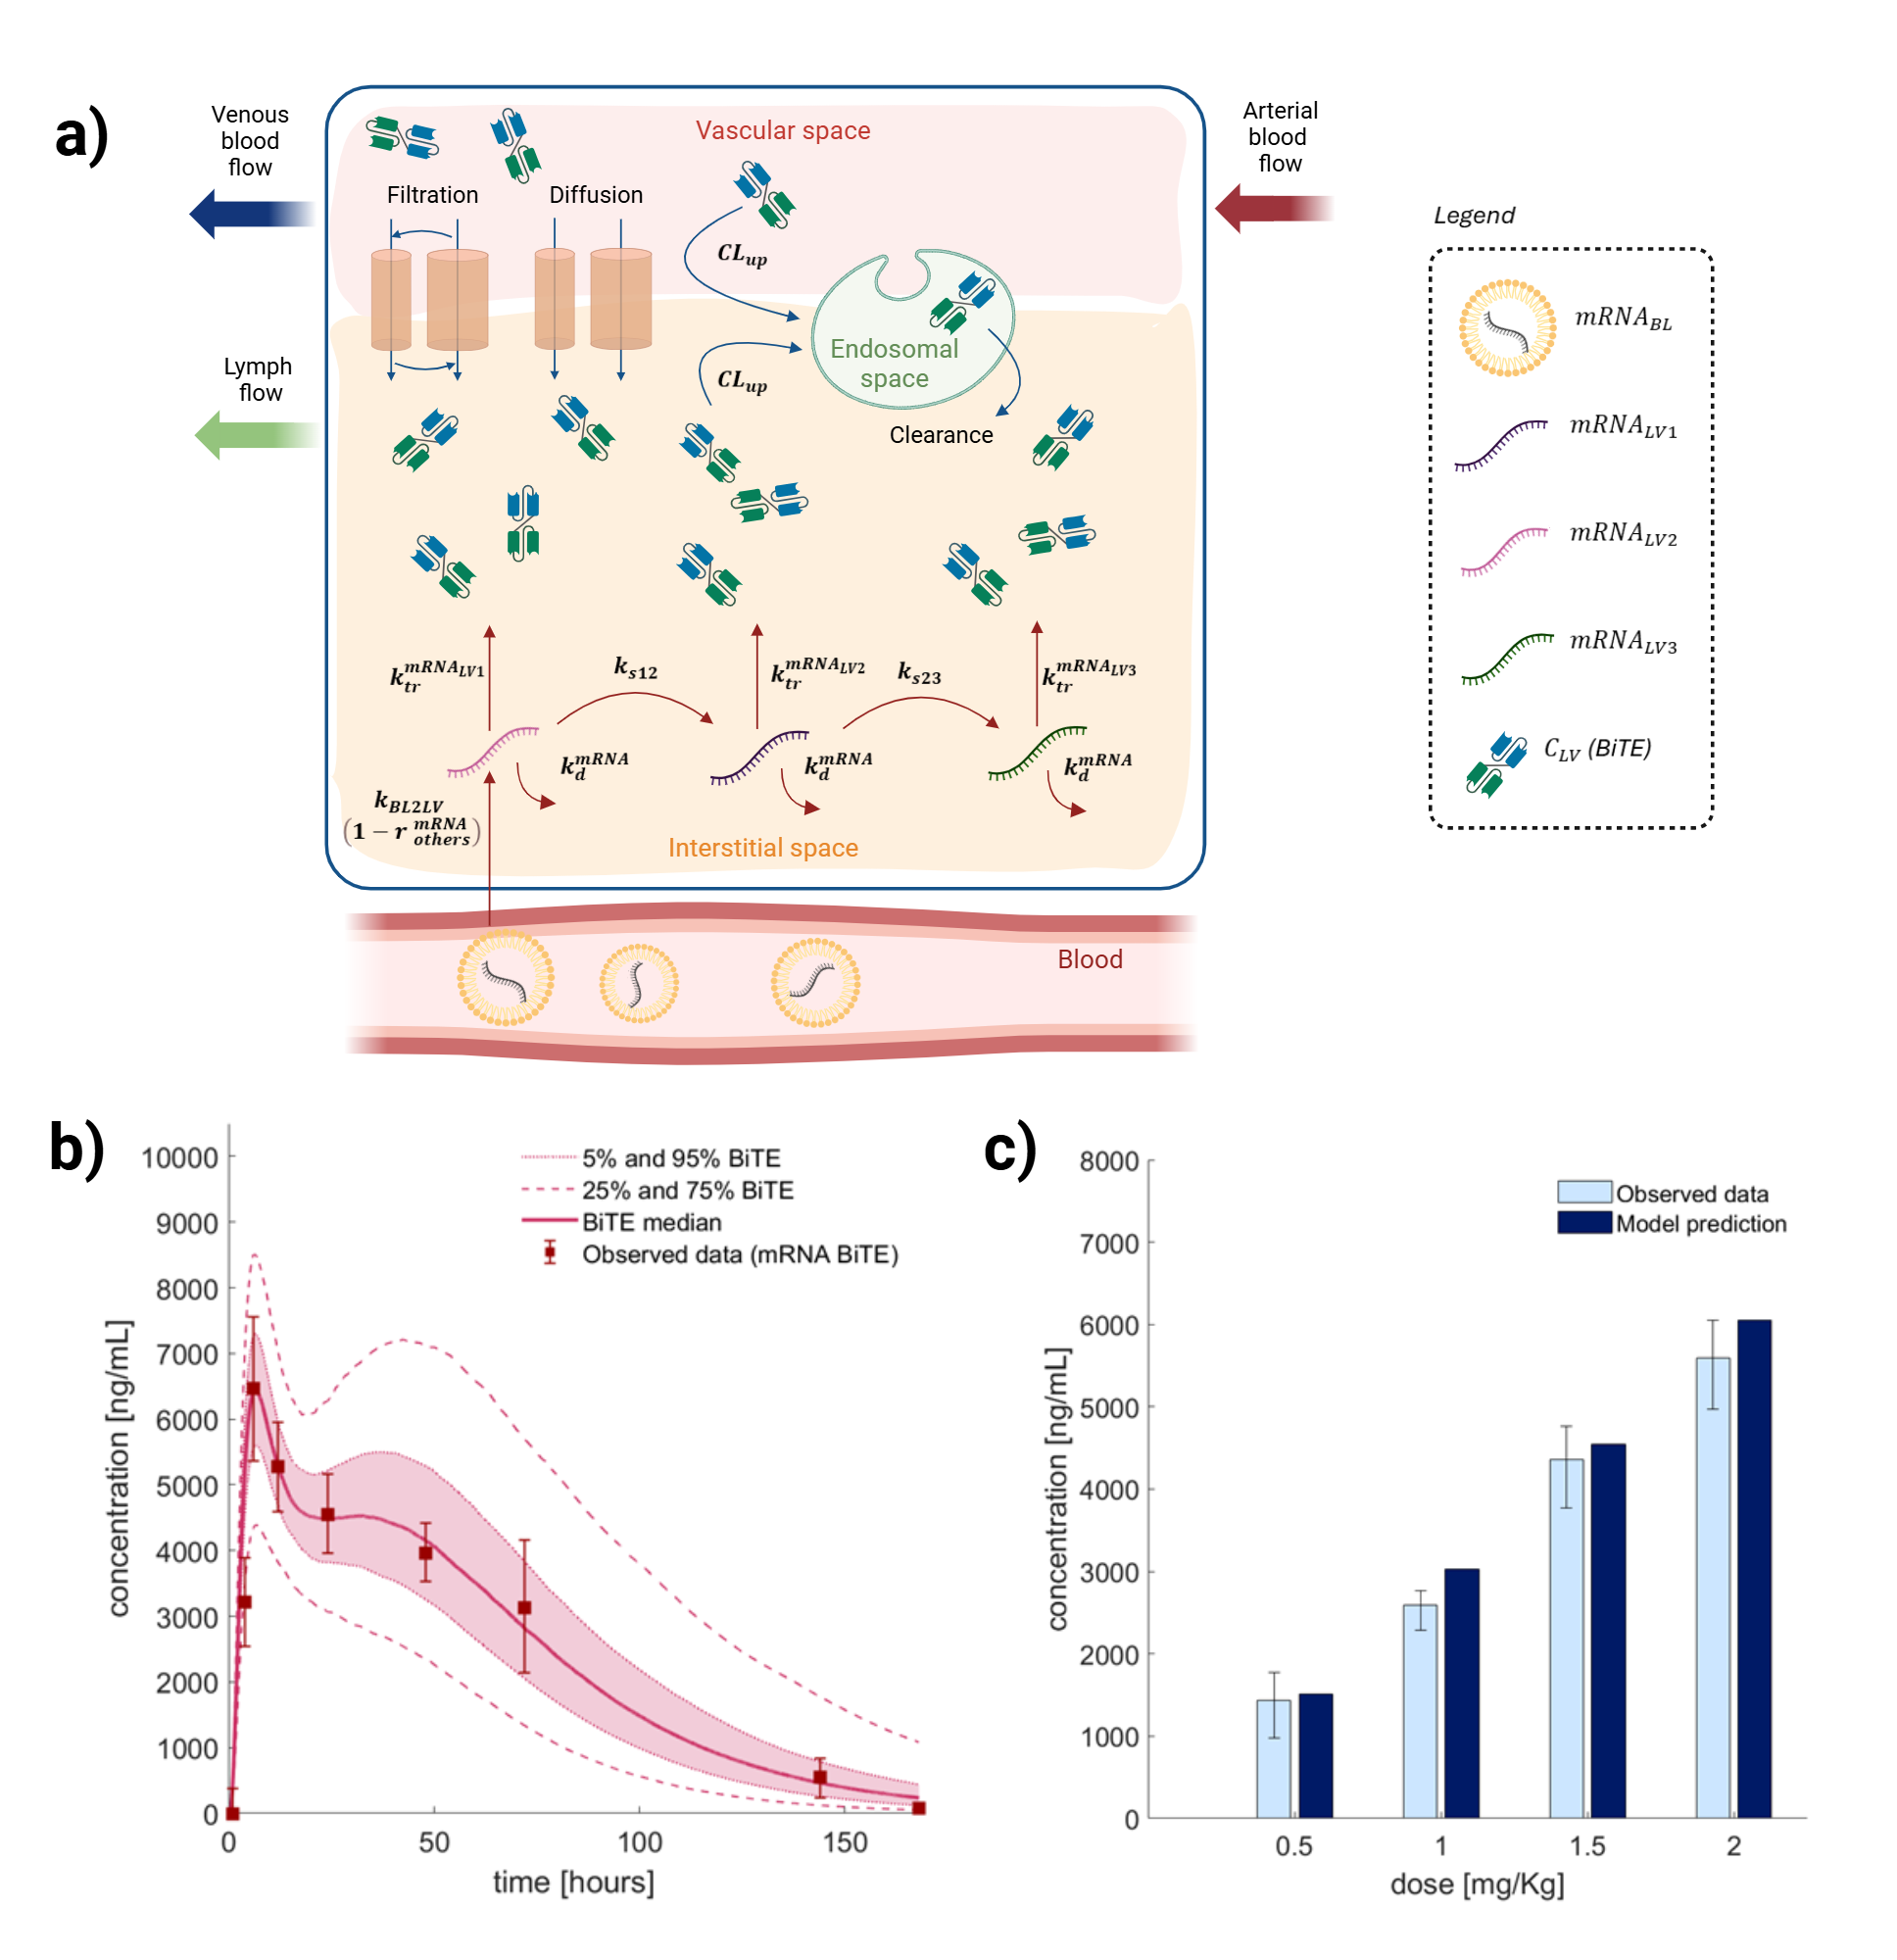

Panel a): schematic representation of the tissue level dynamics modeled in the liver for the LCM. The mRNA injected into the blood is transferred to the liver and its translation takes place in the interstitial space through three mRNA states that contribute to BiTE production. Similarly to the SCM, when BiTEs are produced, they are transported throughout the body via the PTM. Panel b): LCM training results on plasma time series of the mRNA-encoded BiTE reported in Huang et al. (2023)[22]. Uncertainty of the mRNA-based output was estimated by performing a virtual population study. Solid lines represent the median of the concentration in the plasma of BiTEs, dot lines represent the first and the third quartile and dashed lines represent the 5% and 95% of estimated values in the two experimental settings, respectively. Panel c): LCM validation results: the model was tested to reproduce the plasma concentration of BiTEs 24 hours after administration of four different doses of mRNA, as reported in Huang et al. (2023)[22]. The mean and uncertainty of the experimental data are represented in light blue, while the in-silico predicted quantities are shown in dark blue.