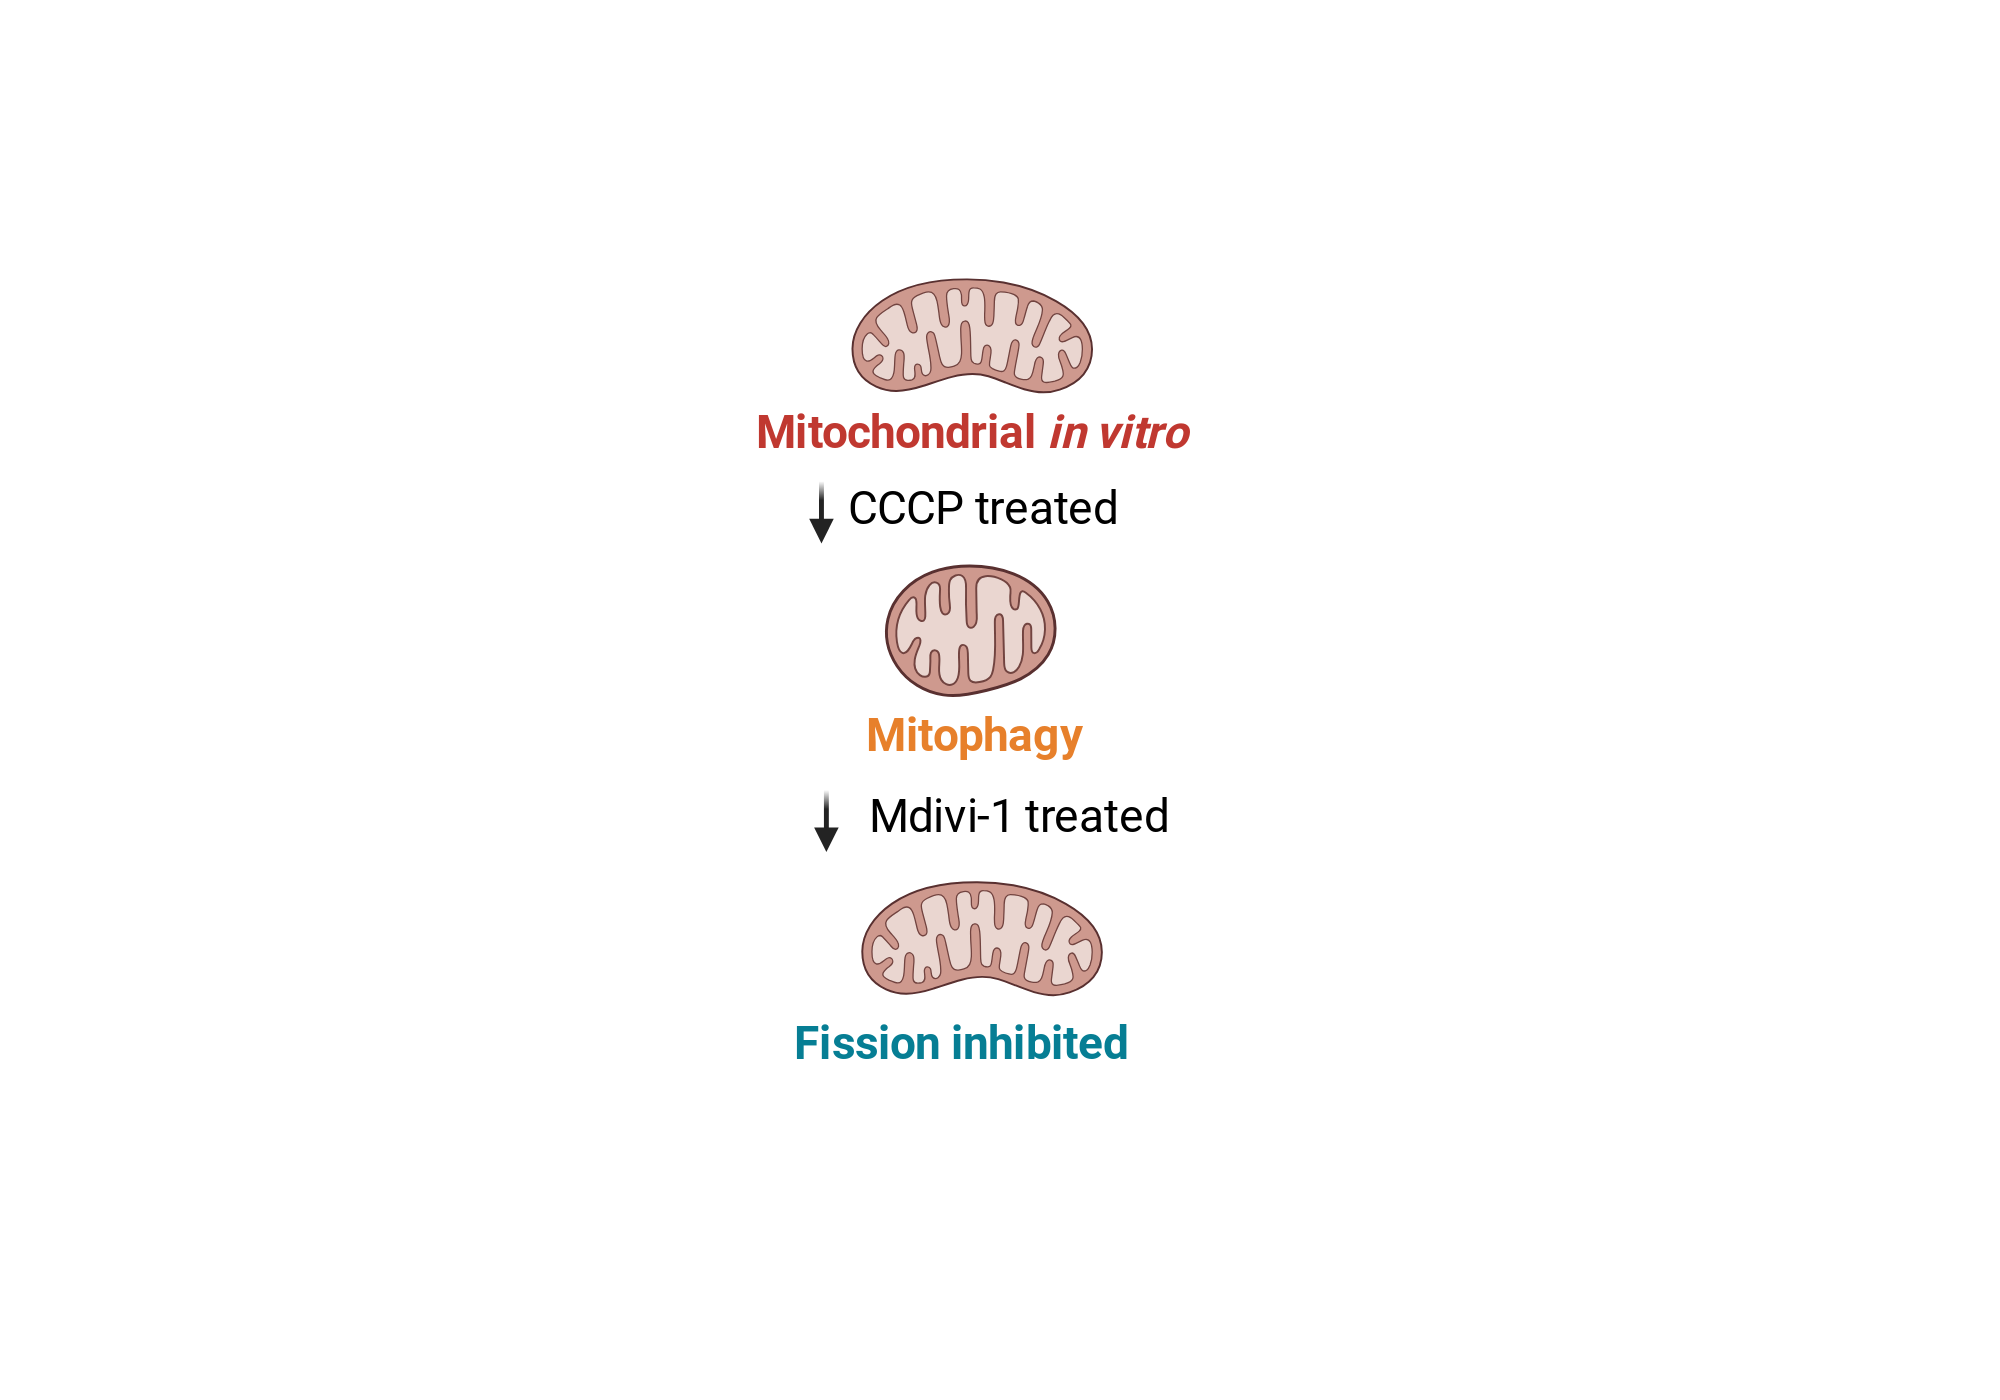
Supplementary Fig. 8a A schematic diagram illustrating the cultivation process of HepG2 cells. Initially, mitophagy was induced in HepG2 cells by CCCP treatment, followed by inhibiting mitochondrial fission with Mdivi-1.
Created in BioRender. Li, L. (2024) https://app.biorender.com/citation/673c09788537ff4641a8c35b
Copy bibliographic reference (APA Style)
Li, L. (2024). Supplementary Fig. 8a A schematic diagram illustrating the cultivation process of HepG2 cells. Initially, mitophagy was induced in HepG2 cells by CCCP treatment, followed by inhibiting mitochondrial fission with Mdivi-1.. Created in BioRender. https://app.biorender.com/citation/673c09788537ff4641a8c35b