Try a synonym, or sign up to suggest a template from the app.
BioRender Template
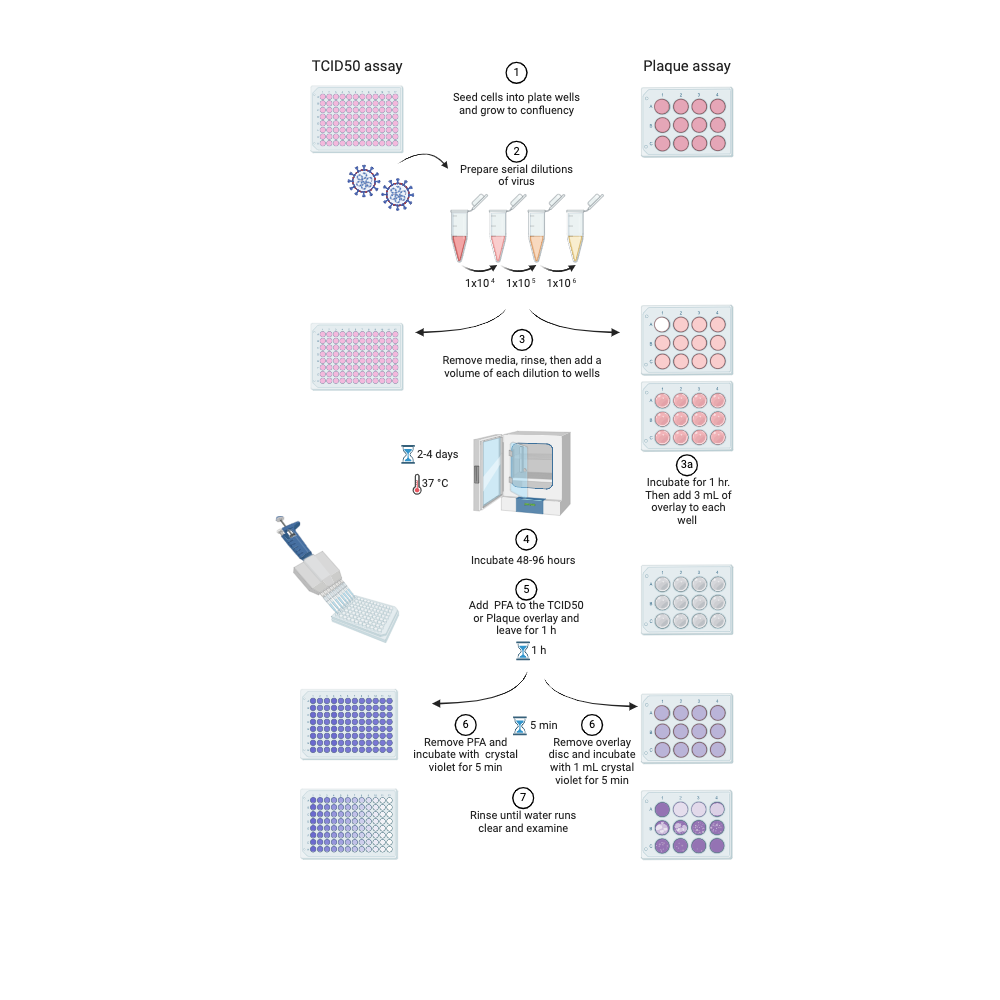
Comparison of TCID50 and Plaque Assays for Defining the Infectivity of a Virus Sample

Creator
s
Description
The figure shows the methodological differences in viral TCID50 and Plaque assays. TCID50 requires mathematical transformations of the data to calculate the final titer, using one of several methods such as:
Spearman–Karber, Reed–Muench, Improved Karber , Weil, or Probit/logit regression.
For plaque assay, the math is simpler: (# of plaques X dilution factor) divided by the volume of the inoculum added to cells in milliliters = plaque forming units per ml.
Use this templateThis template is fully editable in BioRender with a free BioRender account — no credit card required to sign up.
BioRender icons and templates meet journal, grant, and copyright standards. For AI-generated figures, policies vary. Learn More


Don’t start from scratch.
Create professional scientific illustrations quickly and easily, even without any design expertise
- Get started with a huge library of editable icons and templates such as common biological pathways, anatomy, or genetics.
- Create figures that effectively communicate your research in half the time using our editable icons.
- Use our PDB tool to quickly generate and customize protein structures.
.gif)