Try a synonym, or sign up to suggest a template from the app.
BioRender Template
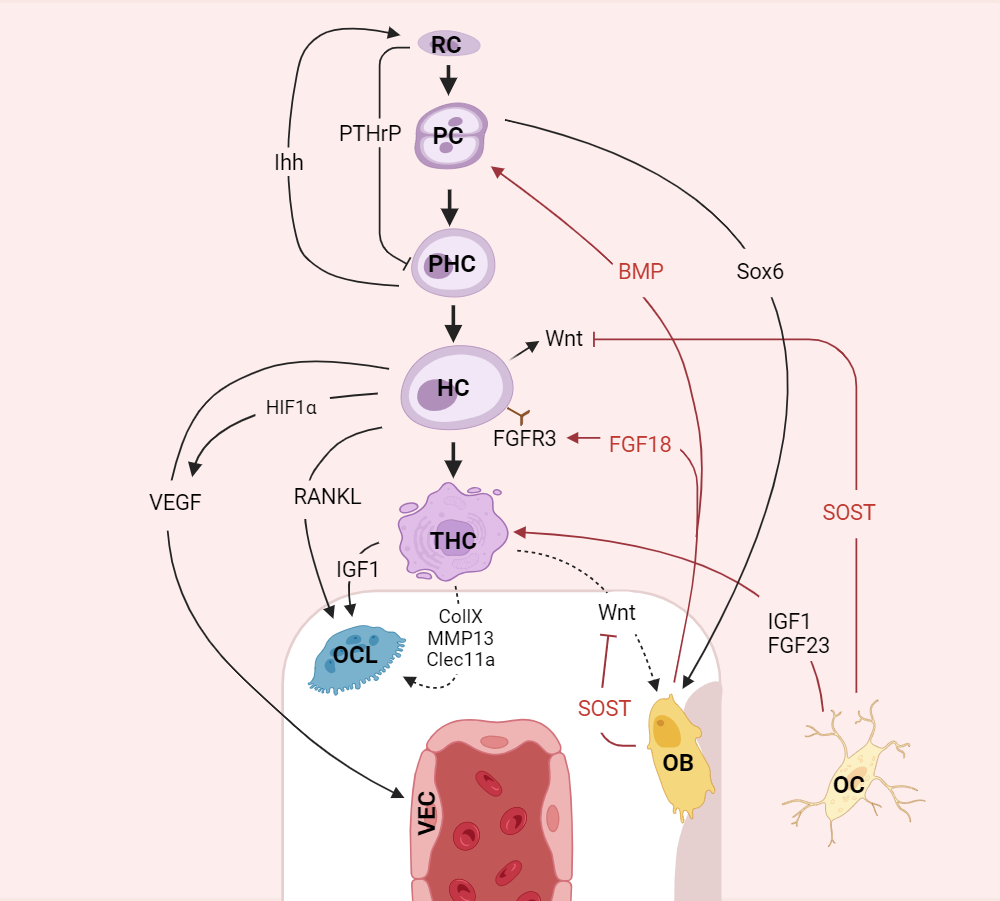
Schematic representation of cellular interactions in the growth plate environment

Creator
s
Description
The diagram shows chondrocyte stages from resting (RCs) to proliferative (PCs), prehypertrophic (PHCs), hypertrophic (HCs), and terminal hypertrophic (THCs). Key signaling pathways, including PTHrP, Ihh, VEGF, IGF1, RANKL, BMP, and FGF18, are indicated with arrows. Interactions between chondrocytes and surrounding cells (osteoblasts, osteoclasts, and vascular endothelial cells) highlight IGF1, FGF23, and Wnt signaling in growth plate regulation, with feedback inhibition SOST also shown.
Use this templateThis template is fully editable in BioRender with a free BioRender account — no credit card required to sign up.
BioRender icons and templates meet journal, grant, and copyright standards. For AI-generated figures, policies vary. Learn More


Don’t start from scratch.
Create professional scientific illustrations quickly and easily, even without any design expertise
- Get started with a huge library of editable icons and templates such as common biological pathways, anatomy, or genetics.
- Create figures that effectively communicate your research in half the time using our editable icons.
- Use our PDB tool to quickly generate and customize protein structures.
.gif)