No items found.

Create scientific graphs, illustrations, and posters in minutes

Over 50,000+ scientifically accurate icons and templates, all fully editable and customizable. No design skills needed, and with optional BioRender-trained AI guidance available.

Trusted by over 4 million scientists and thousands of research institutions

Everything you need, from first draft to final figure

Analyze data, create graphs, and build figures alongside your team. Then, seamlessly turn them into posters, presentations, and more.
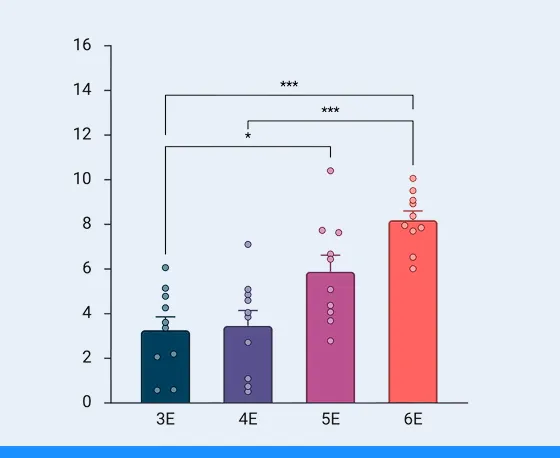
Bar chart showing increasing values with dots for groups 3E, 4E, 5E, and 6E, with 6E highest and statistical significance indicated by asterisks.

Analyze

Analyze and present your research data with automated data formatting and graphing.
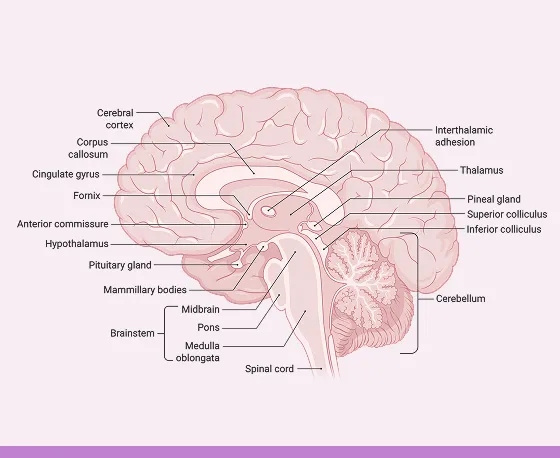
Diagram of a human brain showing labeled parts including cerebral cortex, corpus callosum, cingulate gyrus, fornix, anterior commissure, hypothalamus, pituitary gland, mammillary bodies, brainstem divisions (midbrain, pons, medulla oblongata), spinal cord, interthalamic adhesion, thalamus, pineal gland, superior and inferior colliculus, and cerebellum.

Illustrate

Create figures from our vast library of scientifically accurate and vetted images.

User avatar with chat icon, buttons labeled Share and Export, and a dropdown menu showing options: Present, Copy to PowerPoint, Invite and share with a notification of 3, Add to community, and Send a copy.

Collaborate

Organize, edit, and review figures together in one shared workspace.
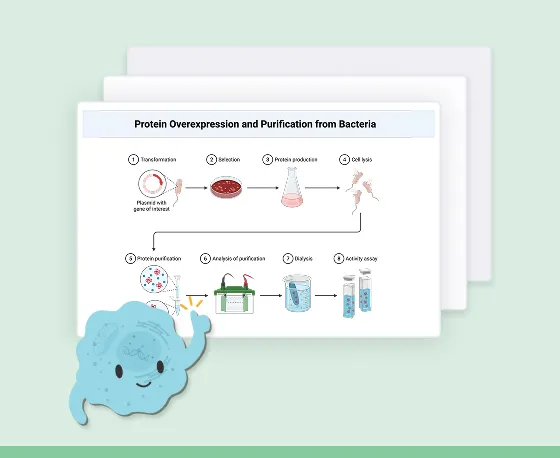
Diagram illustrating protein overexpression and purification from bacteria in six steps: transformation with plasmid, selection on agar plate, protein production in flask, cell lysis, protein purification, analysis of purification by dialysis and activity assay.

Present

Submit and publish clear and concise visuals in grants, journals, filings, and more.

b-cells

BioRender figures do more than just look good

Over 4 Million scientists use BioRender to publish papers, apply for grant funding, and otherwise move their research forward – from the bench to the board room.

Up to 3x

Lorem ipsum dolor

grant funding reported by labs using BioRender

500,000

+

Lorem ipsum dolor

grant funding reported by labs using BioRender

quote icon
In my experience as a grant reviewer, proposals that are easier to follow tend to earn stronger funding recommendations. Clear, polished visuals, like those created with BioRender, make that difference.
Dr. Kevin Zwezdaryk headshot
Dr. Kevin Zwezdaryk
Grant Reviewer & Assistant Professor
Tulane University

Start from a template

Thousands of templates built by professional science illustrators, ready to customize.

Scientific template made using Biorender