Gantt Chart (5 Rows)
This template is fully editable in BioRender
- Swap in different text, shapes, & icons
- Recolor and rearrange every icon, line, & label
- Export or share for any use case

Join 4M+ scientists already making publication-ready figures
Description:
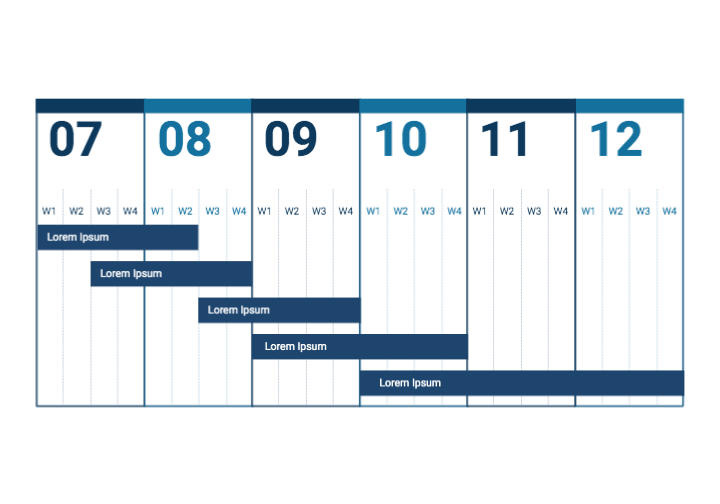
This template shows a Gantt chart spanning six months, labeled 07 through 12, each broken into four weekly columns. Five dark blue bars of varying length and staggered start points represent overlapping placeholder tasks across the timeline.

BioRender icons and templates meet journal, grant, and copyright standards. For AI-generated figures, policies vary. Learn More
Not quite the right template? Discover more.
Search thousands of templates across 30+ life-science fields.
Try a synonym, or sign up to suggest a template from the app.
Newest templates




BioRender Template FAQs
This template shows a Gantt chart spanning six months, labeled 07 through 12, each broken into four weekly columns. Five dark blue bars of varying length and staggered start points represent overlapping placeholder tasks across the timeline.