Try a synonym, or sign up to suggest a template from the app.
BioRender Template
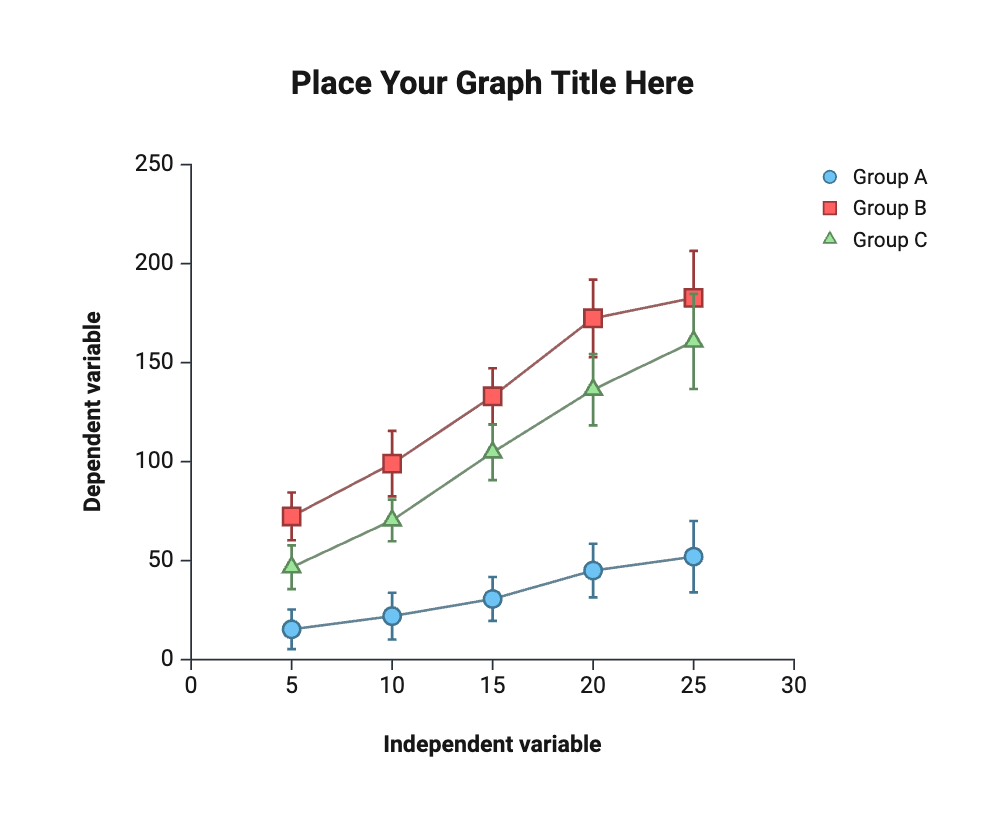
Lineplot | 3 Groups | Mean & SD

Description
This template is a blank line chart layout showing three groups plotted as mean values with error bars across five points of an independent variable. Group B and Group C rise steeply and plateau around 160-185 on the dependent variable axis, while Group A rises more gradually to about 50, illustrating the layout's format for mean and standard deviation data.
This template is fully editable in BioRender with a free BioRender account — no credit card required to sign up.

BioRender icons and templates meet journal, grant, and copyright standards. For AI-generated figures, policies vary. Learn More


Don’t start from scratch.
Create professional scientific illustrations quickly and easily, even without any design expertise
- Get started with a huge library of editable icons and templates such as common biological pathways, anatomy, or genetics.
- Create figures that effectively communicate your research in half the time using our editable icons.
- Use our PDB tool to quickly generate and customize protein structures.
.gif)


