Get your research read, cited, and shared
Stop reviewers, editors, and conference attendees in their tracks with an engaging, easy-to-understand summary of your research findings. BioRender’s graphical abstract tools help summarize complex research in a single image.
1
in
5
Lorem ipsum dolor
Nature biology papers cited BioRender in 2025
50,000
+
Lorem ipsum dolor
scientifically accurate icons and templates
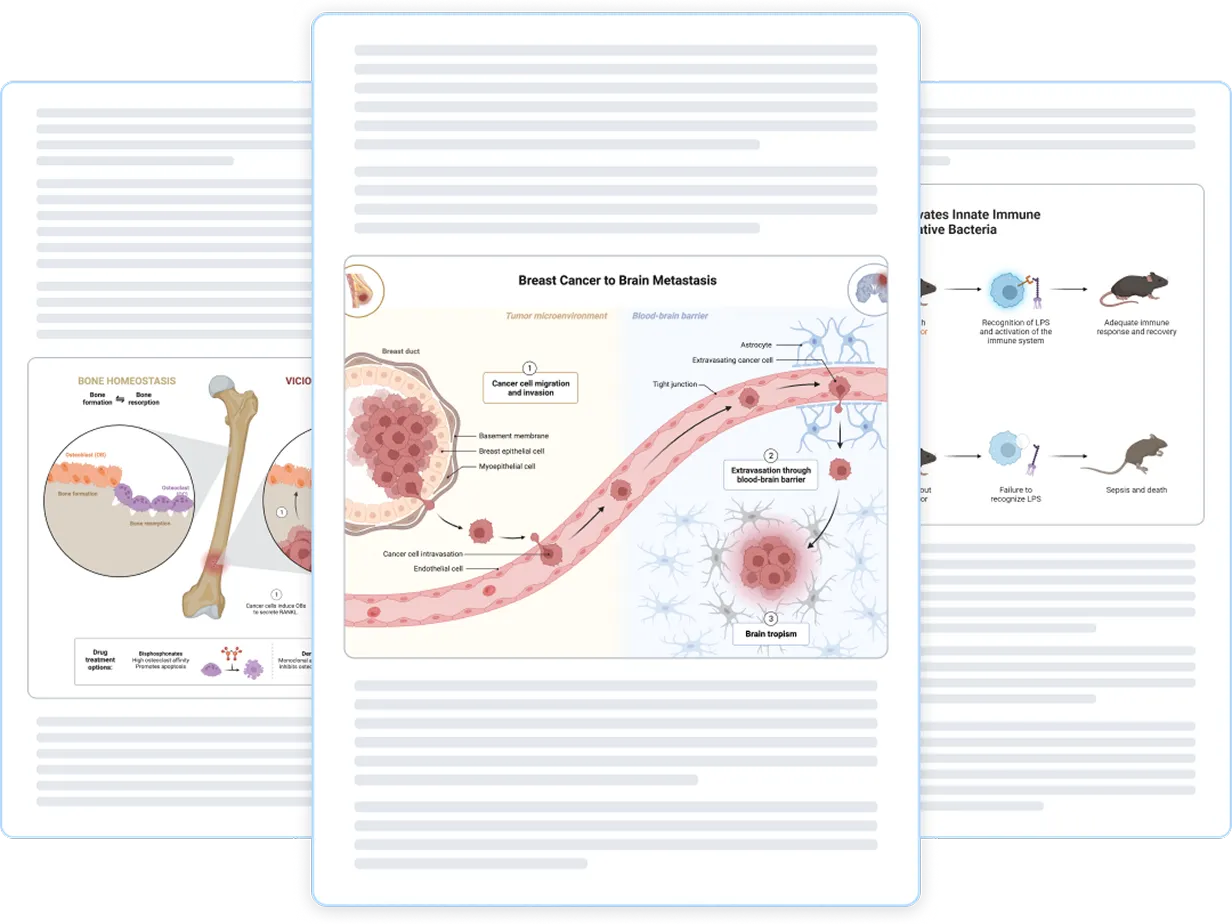
Graphical abstracts made with BioRender have been published in:





What is a graphical abstract?
A graphical abstract is a single illustration that summarizes the main finding of a research paper. Using icons, diagrams, and minimal text, it lets readers understand your research at a glance, before they read the paper.
Required or encouraged by Cell Press, Elsevier, and eLife
Displayed as a thumbnail in journal browsers and tables of contents
Shareable on LinkedIn, X, and lab websites
Understood to scientists outside your immediate field
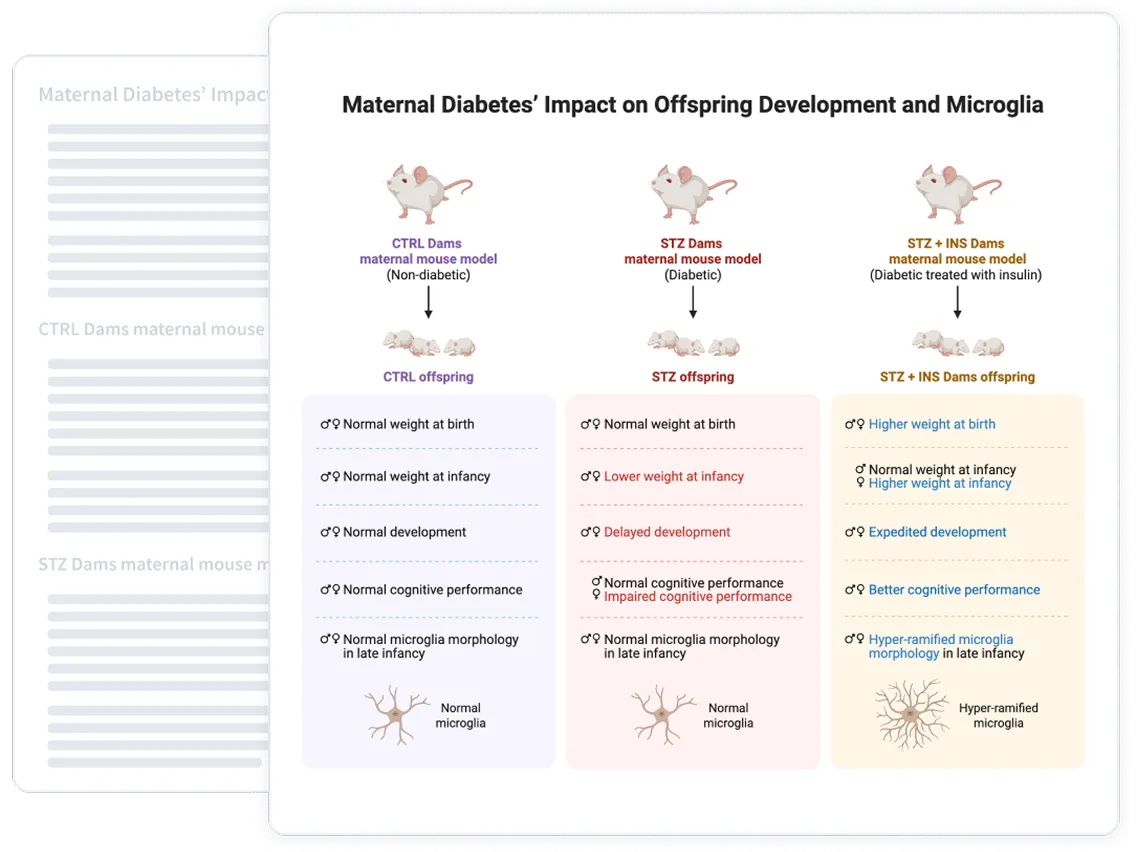
What makes a graphical abstract effective?
Get your point across in a single image by following proven best practices built on principles from BioRender's design team, informed by feedback from journals and editorial staff.
Layout and story flow. Guide the eye left-to-right or top-to-bottom, with comparisons aligned on the same axis.
Color and contrast. Use a limited color palette and reserve emphasis for key findings; verify it reads in grayscale.
Unify visual cues. Use labels and directional cues consistently; keep labels aligned horizontally.
Minimal text. It is a visual overview, not a second written abstract.
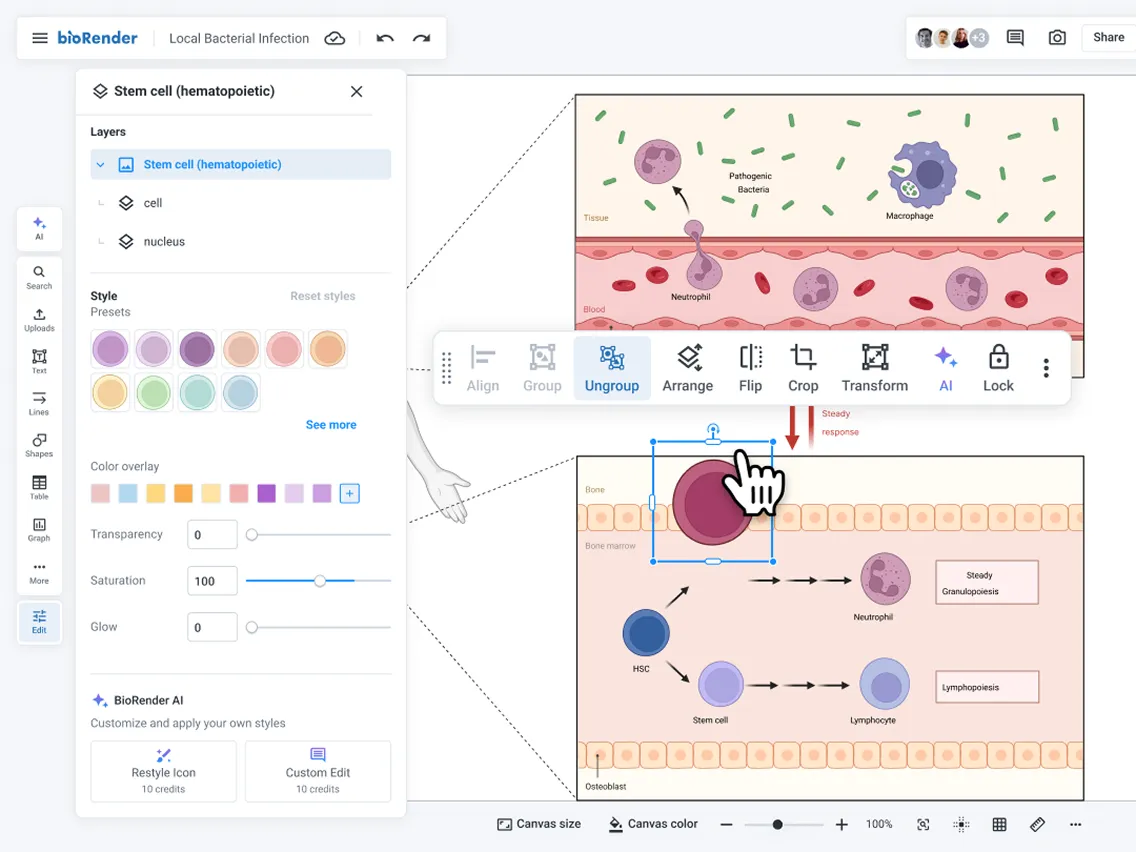
Design an Effective Graphical Abstract
BioRender’s graphical abstract guidelines provide best practices, tips, and what to avoid to ensure clear and easy interpretation of complex concepts.

Science-specific tools for publication-ready graphical abstracts
50,000+ scientifically accurate icons and science symbols, plus templates and design guidance to create graphical abstracts ready for export at any size.
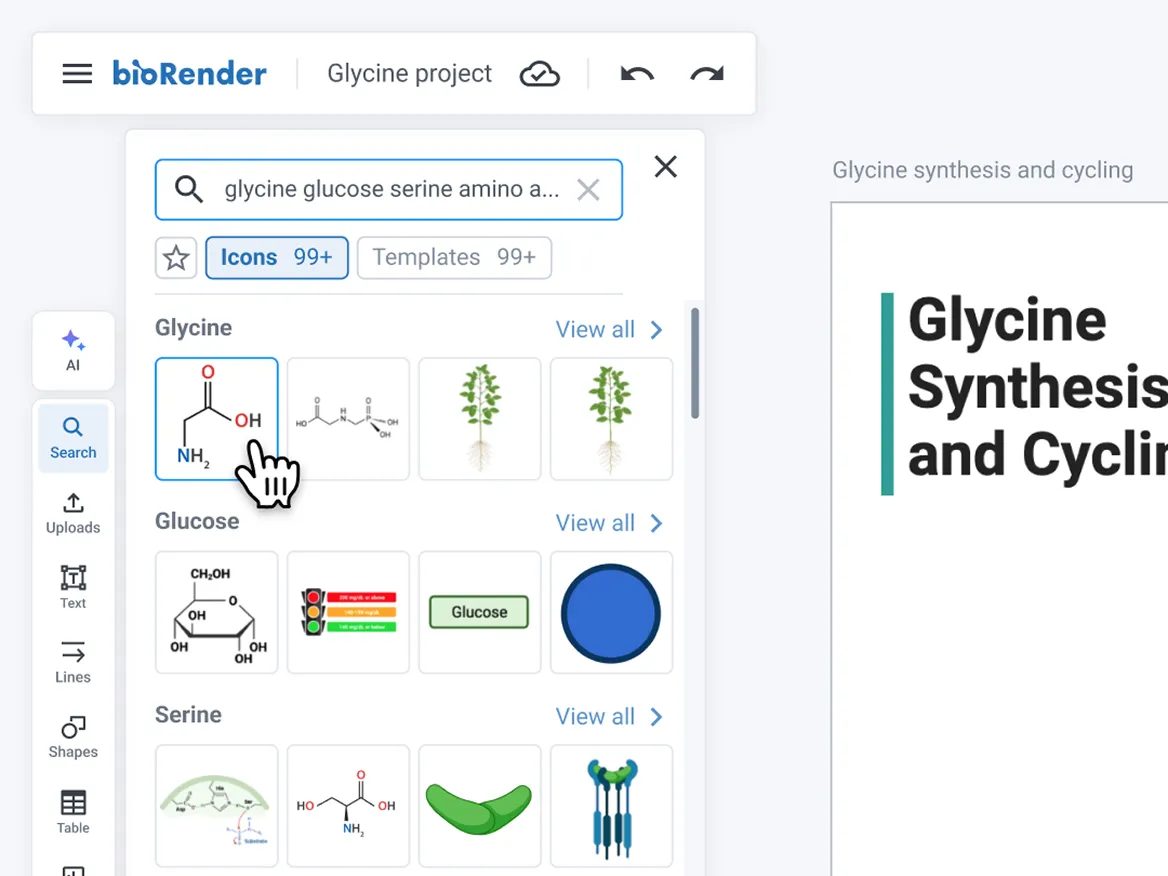
Life science illustrations for graphical abstracts
Browse biological structures, cell types, pathways, laboratory equipment, and clinical illustrations commonly used in life science research. Illustrations are peer-reviewed for scientific accuracy and can be customized to match your research and visual style.
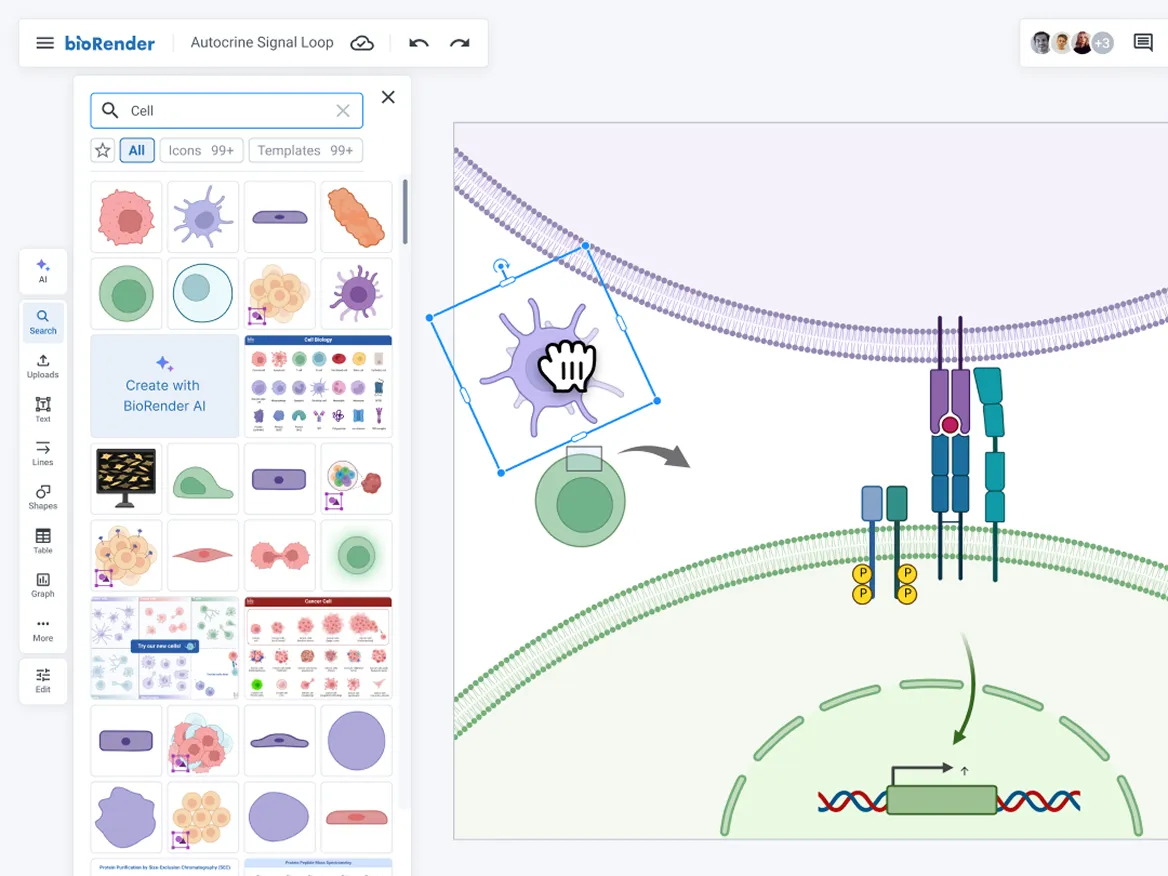
Apply design principles as you work
Smart alignment guides, a curated life science color palette, and gridline tools help you apply the layout, contrast, and labeling principles used in effective graphical abstracts.
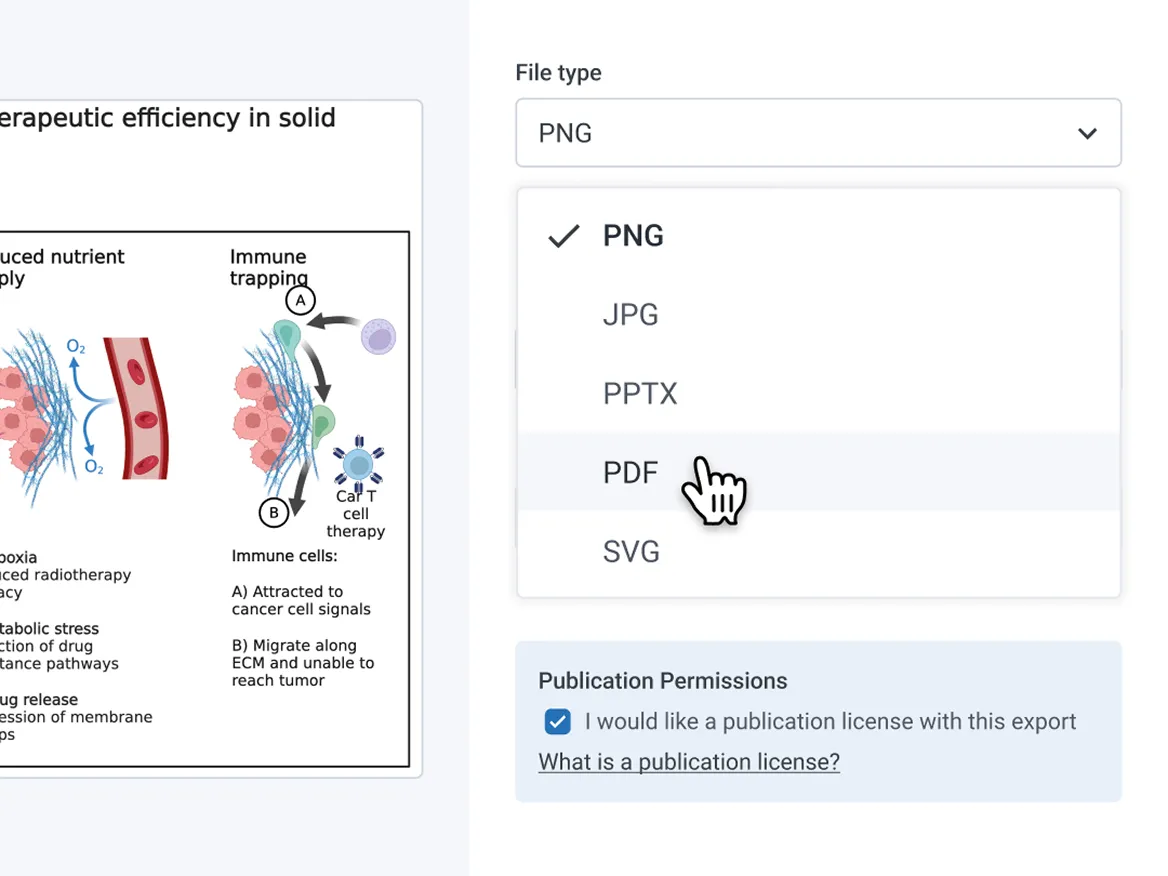
Export in the format you require
Export high-resolution PNG, SVG, or PDF files, each with a usage license statement for journal submissions. BioRender graphical abstracts have been published in Cell Press, Nature, Elsevier, and more.
Use one graphical abstract for every audience
A graphical abstract does more than satisfy a journal requirement. It becomes the visual anchor for your science everywhere it appears.

Scientific Posters
Conference-ready poster templates with accurate, peer-reviewed icons. Repurpose figures from papers.

Presentations
Turn your figures into slides. Export to PPT or use BioRender’s presentation templates.


Grant Applications
Create NIH and NSF-ready figures and graphs that score well before reviewers even reach the methods section.

Lab Website
Make your research accessible to the public, with clear and accurate figures that communicate at-a-glance.

Social Media
Post links to your public-facing citation pages to ResearchGate, LinkedIn, X, Bluesky, Reddit and more.
Frequently asked questions
What is a graphical abstract?
A graphical abstract is a single illustration that summarizes the main finding of your research at a glance. Using illustrations, diagrams, and minimal text, it helps readers understand the main finding of your research before reading the full paper. Many journals display it in article listings and table of contents pages, where it provides readers with a quick overview of the work.
Do I need one for my journal submission?
Most major journals require or encourage using graphical abstracts. Cell Press journals and many Elsevier journals require graphical abstracts, while Nature and Science make them optional. Check your target journal's author guidelines for specific requirements. Explore BioRender's template gallery or learn more about using BioRender for journal publications.
What size or format do journals require?
Requirements vary by journal. Cell Press requires a 1200 × 1200 px TIFF or EPS file. BioRender templates are pre-sized for supported journals, and the canvas adjusts automatically when you select a journal. Custom dimensions are also available. To learn more, visit BioRender’s guide for resizing the canvas.
How long does it take to make a graphical abstract in BioRender?
Most researchers complete a graphical abstract in 1–3 hours, however, time can depend on the complexity of the research and the level of detail needed. BioRender templates provide a starting structure, and design guidance, which significantly reduces the amount of time spent on layouts and formatting. To learn more, visit BioRender’s graphical abstract guide.
Can I reuse my graphical abstract for a poster, grant, or social media?
Yes. A BioRender graphical abstract can be adapted for conference posters, seminar slides, grant applications, social media posts, and lab websites. Resize the canvas and adjust the layout while keeping illustrations editable. To learn more, visit BioRender’s guide for resizing the canvas.
What should a graphical abstract include?
A graphical abstract should communicate the main finding of a paper in a single visual summary. Most graphical abstracts include the research question, key experimental results, and the primary conclusion, presented with illustrations, diagrams, and minimal text.
The goal is to help readers understand the central message of the research quickly. Effective graphical abstracts focus on one clear takeaway, use a logical visual flow, and avoid including every experimental detail from the paper. To learn more, read BioRender’s Top 4 tips for designing a graphical abstract.
What is the difference between a graphical abstract and a visual abstract?
A graphical abstract summarizes the main finding of a research paper using illustrations, diagrams, and minimal text. Visual abstracts are more common in clinical and medical research and typically use a structured layout that combines short text summaries with data points and visual elements.
Graphical abstracts often emphasize scientific mechanisms, workflows, or biological processes, while visual abstracts are designed to communicate study outcomes quickly to broader audiences, including clinicians, policymakers, and readers on social media.
How many words should a graphical abstract have?
There is no universal word limit for graphical abstracts, but most journals encourage minimal text. The focus should be on communicating the main finding visually rather than repeating the written abstract.
In general, graphical abstracts work best when text is limited to essential labels, annotations, and brief explanatory phrases. Always check your target journal's author guidelines, as requirements vary by publisher. To learn more, watch BioRender’s Top Design Tips for Graphical Abstracts.
Is BioRender free for students?
Anyone can use BioRender's free plan, and BioRender also offers discounted student subscriptions with additional features. Many universities and research institutions also have institutional licenses that give students full access. Check with your library or research office to see whether your institution has access. For pricing details, visit BioRender's pricing page.
Summarize your findings with an image readers can understand
Create a graphical abstract that communicates your findings effectively across journal submissions, grant applications, conference posters, and seminar slides.